Last week, I told you about myself. The most important thing about me is what I learned from an old trader who liked to tell me “To know what everyone knows is to know nothing.” This led me to develop a unique indicator, my Income Trader Volatility (ITV) tool.
This week I want to describe that tool to you.
Next year will mark the 10th anniversary of my Charles H. Dow Award win. I still use the strategy I detailed in that paper in exactly the way I explained it. But the tool is better today than it was ten years ago.
Markets have changed a great deal over the past decade. High frequency traders (HFT) changed the way we trade stocks. Then, they turned their attention to the options markets. That created more trading opportunities for me.
I realized that the HFT firms were trying to maximize their profits. They were still using the same old ideas including put-call parity and profiting from the spreads. This means we, as individuals, can now trade more options than ever before thanks to their efforts.
That means I can use my ITV strategy more than ever in options. I also realized it created opportunities in stocks.
The idea is pretty simple. I understood there was a way to measure volatility for each individual stock or ETF, then developed a timing strategy to show when high volatility (or “fear”) is giving way to low volatility (or “greed”).
The ideal time to sell an option is when volatility shifts from high to low. At that time, options are overpriced so we benefit from the decline in the options premium. It’s also when prices are starting to move in a predictable way, so we profit from the directional move. Combined, those two factors maximize gains in options.
Over time, I realized I was profiting from the usual pattern in volatility. This led me to a new goal – I wanted to find a way to profit from unusual volatility.
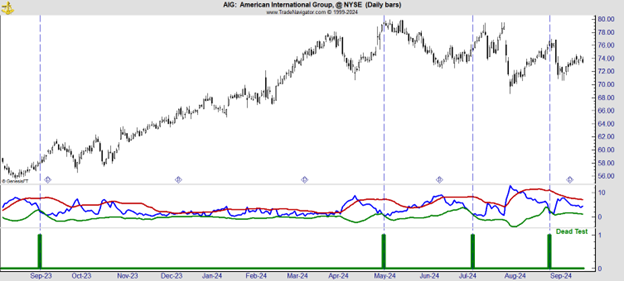
Here’s the key: unusual volatility often leads to big price moves. On the chart below, you can see my volatility indicator in blue, with red and green Bollinger Bands set at 2.1 standard deviations. This little tweak makes a difference because volatility behaves a bit differently than price. When the blue line dips below the lower band, it’s time to buy—this is shown by the green bars on the chart (just for your visual reference).

Now, here’s the backstory. I backtested this on S&P 500 stocks over the past decade, and with a simple eight-week holding period, the average gain was 2.87%. For a bit more confidence, I ran the same test on the Nasdaq 100 stocks and found a 61.4% win rate, with an average gain of 3.6% per trade. This isn’t even optimized—just straightforward, reliable signals.
With that win rate and average gain, this setup maximizes exposure to winners and has the potential to keep the losers from taking a huge bite out of our profits.
This is the “quick compounding” I talked about earlier—a way to grow wealth faster without needing a time machine.
If you have any questions about to trade using the ITV indicator submit them here.


