FOMO—the fear of missing out—might be the most powerful force in the markets.
Price action is normally driven by fear and greed. Fear, of course, drives bear markets. Eventually, in a bear market, greed replaces fear and drives prices relentlessly higher. And sometimes, greed gives way to FOMO.
At these times, we tend to see large price moves, driven by the fact that investors have watched others enjoy large gains. This is compounded by social media, where traders often brag about their successes.

After seeing so many people make so much money in a market, FOMO takes hold.
FOMO seems to be appearing in the gold market right now. I know this because of an indicator I developed to identify FOMO.
The idea behind the indicator is simple. I measure fear and greed based on price action. When greed becomes extreme, individuals are prone to FOMO.
Gold offers an excellent example of this behavior. As gold prices rise, we can actually see behavior change. High gold prices bring out the sign twirlers who appear in front of “we buy gold” stores. You’ve certainly seen them. They stand alongside busy roadways, trying to catch your attention. The sign is typically an arrow pointing toward the store. The message on the sign is simple. It usually says something like “We Buy Gold” or “Top Prices for Gold.”
There aren’t many sign twirlers when the price of gold is low. But as prices rise, they appear. Prospective sellers may have heard news stories about rising prices. The gold buyers hope that’s all they know.
If a seller brings in old jewelry, the buyer profits by purchasing it at a low price. Sellers may not realize they could get more for their gold at other stores; they just know that they’re getting in on the market while prices are high. They also know others must be selling gold, and they don’t want to miss out on these high prices.
It’s FOMO. It’s a visible example of this psychological phenomenon.
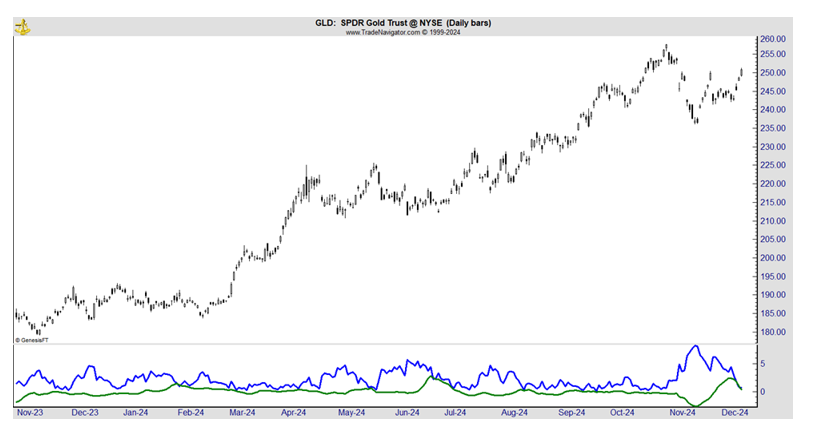
Realizing that you can see FOMO led me to create this indicator. You can see it at the bottom of this chart of gold prices:

This is actually a chart of the SPDR Gold Shares ETF (GLD), which offers individual investors a simple way to buy and sell gold.
The indicator at the bottom of the chart tracks emotions. In that way, it’s similar to the widely followed VIX index. The VIX is widely known as the “fear gauge” because it rises when fear increases. This indicator also rises as fear rises. That means low readings, like we see now, are associated with the opposite of fear: greed.
When greed becomes extreme, FOMO can develop. It’s almost as if traders are following the twirling sign.
What this means for GLD is most likely higher prices in the short term. This is not a long-term indicator, because FOMO cannot last forever. It’s an extreme emotional reaction, and extreme emotions can’t last long. Even children throwing fits eventually tire themselves out.
When FOMO appears in a market, the increase in prices is likely to be rapid but relatively brief. These rallies generally last for a few weeks to a few months.
In the past, after signals like this, GLD rallied an average of 8.4% over the next two months.
I’ll be back next week with more details on this indicator.
Until then, reach out to me if you have any questions about FOMO, the ITV Indicator, gold or anything else investing related. Click here.


