Jay’s Fed Trade: $1,100 Weekly Income
Former market maker Jay Soloff found an ETF that could pay $1,100 weekly. Wednesday’s Fed decision will trigger massive volatility. This specialized ticker converts Wall Street’s chaos into weekly cash flow. Get the ticker symbol free.
September 17, 2025 - 10:00 am
Weekly Trades Ahead of the Fed
Dear Subscribers,
Like many of you, I’m interested to hear what the Fed has to say this afternoon. I’ll wait to share my thoughts until after we’ve had a chance to digest their decision and remarks.
In the meantime, our weekly trades are ready.
The Top Instant Income Opportunities This Week
Below you will find the top trade candidates identified by the Income Trader Volatility (ITV) indicator. Each of these trades recommends selling (to open) a put option. If you’re looking to make additional Instant Income trades, I can’t think of a better list of stocks to start your research.
Bonus trades have less stringent risk parameters, and these trades have slightly more risk than trades I recommend for the Income Trader portfolio. Risk is still relatively low in a bonus trade, but it is not low enough to pass my most rigorous screens. We recommend closing all bonus trades when they trade at $ 0.10 or below.
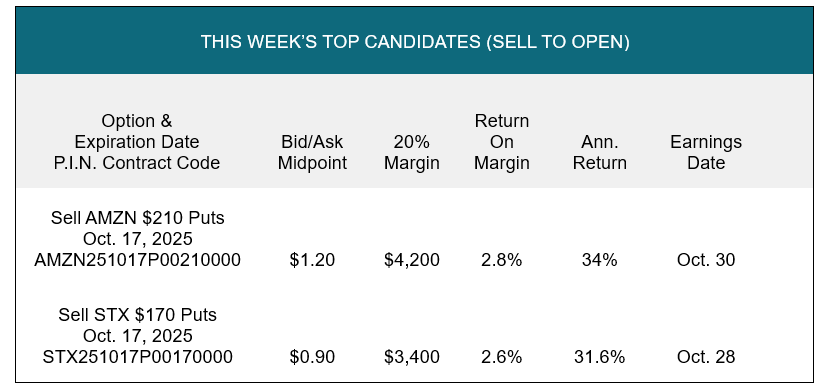
I always recommend the use of limit orders when entering an options trade. A limit at the midpoint between the bid and ask prices will often be filled fairly quickly.
The charts below show this week’s top candidates: In the upper section of each chart, you can see the stock’s weekly price movement; in the bottom section, you’ll see the stock’s ITV (red line) and the ITV’s 20-week moving average (blue line).


Thank you for your continued trust. I’ll follow up after the Fed meeting.
Good Trading,

September 10, 2025 - 8:00 am
Historic Labor Revision Keeps Premiums Elevated
It takes a historic revision to knock nearly a million jobs off the payroll count, yet even that was not enough to push the Federal Reserve toward deeper cuts.
The market recalibrated quickly, sending yields higher, but what stands out most is the persistent demand for volatility protection. Option premiums remain elevated even as market movement stays contained.
The Bureau of Labor Statistics removed 911,000 jobs from the roster in its annual benchmark adjustment, the largest revision on record. The reduction confirmed that the labor market was weaker than reported, though not weak enough to change policy expectations.
Yields climbed in a bear-flattening move, with the short end leading as traders adjusted to diminished odds of a half-point cut next week.
Equities were little changed overall, but the Russell 2000 declined as small caps absorbed the heaviest pressure from higher rates. Larger companies held up better, while the main story for us is the continued bid for protection.
Implied volatility remains above actual market movement, leaving premiums attractive to collect.
Focus now turns to PPI and CPI. Consensus forecasts sit at 3.3 percent and 2.9 percent, while my expectations are lower. Even if softer numbers are confirmed, they will not justify a half-point cut.
The buildup into these releases has already lifted option premiums. If price movement remains contained after the releases, we keep the advantage.
The coming days will bring new data and shifting narratives, but the underlying setup has not changed. Premiums remain inflated, market movement is contained, and the ITV indicator continues to find winning trades for us.
The Top Instant Income Opportunities This Week
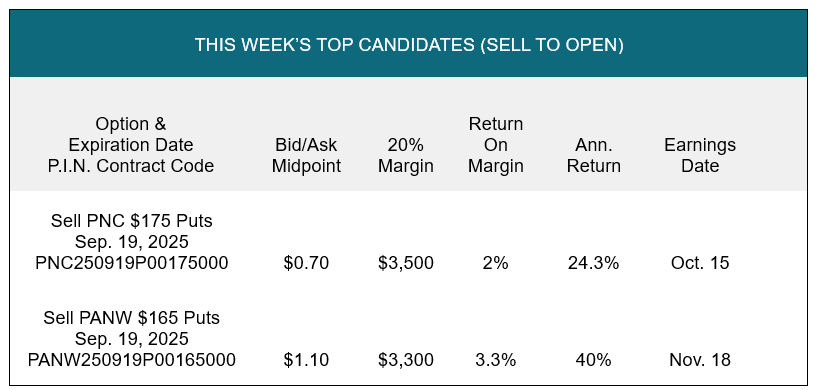
Below you will find the top trade candidates identified by the Income Trader Volatility (ITV) indicator. Each of these trades recommends selling (to open) a put option. If you’re looking to make additional Instant Income trades, I can’t think of a better list of stocks to start your research.
Bonus trades have less stringent risk parameters, and these trades have slightly more risk than trades I recommend for the Income Trader portfolio. Risk is still relatively low in a bonus trade, but it is not low enough to pass my most rigorous screens. We recommend closing all bonus trades when they trade at $ 0.10 or below.

I always recommend the use of limit orders when entering an options trade. A limit at the midpoint between the bid and ask prices will often be filled fairly quickly.
The charts below show this week’s top candidates: In the upper section of each chart, you can see the stock’s weekly price movement; in the bottom section, you’ll see the stock’s ITV (red line) and the ITV’s 20-week moving average (blue line).


Good Trading,
September 3, 2025 - 10:11 am
September Kicks Off with a Shift in Sentiment
The market opened September in retreat, and while it’s easy to point to seasonal patterns, the real drivers of the recent weakness are more complex.
A mix of global bond market pressure, renewed tariff uncertainty, and early talk of a potential government shutdown triggered a more cautious tone.
It’s true that September is statistically the weakest month for the S&P 500 over the past 25 years, with an average return of –1.51%. But that’s not the whole story.
Even with that average, roughly half of those Septembers still finished positive. Last year’s +2% return is a reminder that expectations and outcomes don’t always match.
More telling than the numbers was the tone shift on the tape. Dip buying, which has fueled much of this year’s rally, was muted. Several intraday bounce attempts were quickly faded, and the S&P gave back much of its post-Jackson Hole gains.
This wasn’t panic, but it wasn’t confident either.
At this point in the year, it’s not unusual for traders to step back and reassess. We’ve seen a powerful run driven by falling rate expectations and persistent demand for risk. Now the question becomes: how much more upside can that same playbook deliver?
The technical picture reflects this pause. The S&P is testing key levels, and while short-term rate cut odds remain elevated, the tone feels different. Markets are recalibrating.
That doesn’t mean we abandon the trend, it means we watch for signals that confirm it’s still valid.
While we continue to follow market developments closely, our process remains centered on the ITV indicator. That discipline is what allows us to trade with clarity, especially when the market tone becomes uncertain.
The Top Instant Income Opportunities This Week
Below you will find the top trade candidates identified by the Income Trader Volatility (ITV) indicator. Each of these trades recommends selling (to open) a put option. If you’re looking to make additional Instant Income trades, I can’t think of a better list of stocks to start your research.
Bonus trades have less stringent risk parameters, and these trades have slightly more risk than trades I recommend for the Income Trader portfolio. Risk is still relatively low in a bonus trade, but it is not low enough to pass my most rigorous screens. We recommend closing all bonus trades when they trade at $ 0.10 or below.

I always recommend the use of limit orders when entering an options trade. A limit at the midpoint between the bid and ask prices will often be filled fairly quickly.
The charts below show this week’s top candidates: In the upper section of each chart, you can see the stock’s weekly price movement; in the bottom section, you’ll see the stock’s ITV (red line) and the ITV’s 20-week moving average (blue line).


Good Trading,
August 27, 2025 - 8:00 am
What’s Driving Services Inflation—and What It Means for Rates
Following last week’s Jackson Hole symposium, both stocks and bonds responded with renewed optimism. Markets are now pricing in two potential rate cuts starting in September. The shift in expectations comes as inflation data shows some modest stickiness, but not where many expected.
The recent uptick in core inflation hasn’t been fueled by goods, even amid tariff discussions.
Instead, the pressure has come from services, specifically discretionary sectors like air travel and financial advisory. Airline fares rose notably in the July CPI and PPI reports, and brokerage and advisory firms have shown increased pricing power, supported by broader strength in asset markets.
This reflects growing consumer confidence. Fears of recession earlier in the year have eased. Discretionary spending is picking up, which gives service providers room to raise prices, even in a low-oil environment.
But underneath the surface, several key areas remain soft.
Real estate continues to struggle. Inventory is high, pricing power is weak, and new home sales data suggests continued pressure. Existing home prices, which matter most to household wealth, are barely positive year-over-year and could turn negative soon. Credit-sensitive sectors like this stand to benefit the most from easing.
Manufacturing is showing mixed signals. Capital investment is strong, but order volume has been weak until a recent jump in PMI data. And labor markets still lack the cyclical hiring strength needed to fuel broader expansion.
Meanwhile, a slowdown in immigration is pressuring labor supply in housing-related industries and reducing rental demand, two headwinds that further weigh on real estate.
Markets expect the Fed to begin cutting rates in September, and some would argue it should have started already. With inflation in the mid-2% range and weakness in key sectors, there’s a case for easing to support broader participation in the recovery.
In fact, small-cap stocks, often more sensitive to monetary policy, led the rally during the Jackson Hole meeting, rising around 4%. Other rate-sensitive sectors also responded: industrials, materials, real estate, technology, discretionary, and energy all gained.
For now, that tells us what traders are watching, and where momentum could build if rate cuts materialize.
The Top Instant Income Opportunities This Week
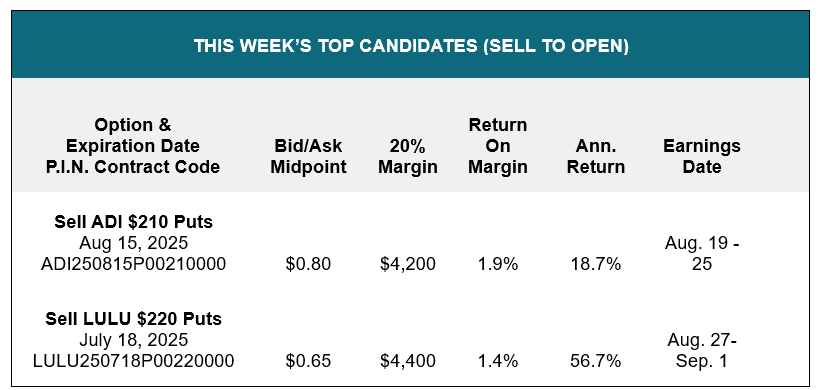
Below you will find the top trade candidates identified by the Income Trader Volatility (ITV) indicator. Each of these trades recommends selling (to open) a put option. If you’re looking to make additional Instant Income trades, I can’t think of a better list of stocks to start your research.
Bonus trades have less stringent risk parameters, and these trades have slightly more risk than trades I recommend for the Income Trader portfolio. Risk is still relatively low in a bonus trade, but it is not low enough to pass my most rigorous screens. We recommend closing all bonus trades when they trade at $ 0.10 or below.

I always recommend the use of limit orders when entering an options trade. A limit at the midpoint between the bid and ask prices will often be filled fairly quickly.
The charts below show this week’s top candidates: In the upper section of each chart, you can see the stock’s weekly price movement; in the bottom section, you’ll see the stock’s ITV (red line) and the ITV’s 20-week moving average (blue line). These charts usually show several previous signals and could help subscribers evaluate how successful signals were in the past.


Good Trading,
August 20, 2025 - 10:31 am
What Central Bank Independence Means for Markets Right Now
Central bankers from around the world are meeting this week to discuss inflation, labor markets, and the macroeconomic outlook. But the backdrop is more charged than usual.
Alongside the formal agenda, there’s a growing concern taking center stage: the independence of central banks.
In the past, central banks largely operated free from political interference, especially in developed economies. That independence helped stabilize inflation and guide long-term policy decisions.
But as pressure mounts, questions are resurfacing about whether monetary policy can remain insulated from political agendas.
This matters more than most headlines suggest.
The bond market, currency market, and even short-term rate expectations all respond to perceived credibility. When a central bank is seen as independent and consistent, markets tend to remain anchored.
But when that independence is questioned, whether through public pressure campaigns or politicized appointments, expectations shift. Investors start pricing in not just the data, but the motives behind the decisions.
So far, the U.S. economy has weathered this relatively well. Stocks are near highs, and inflation expectations are stable.
But market pricing still reflects the tension. The dollar has softened, long-end yields are rising, and policy expectations are increasingly reactive to public commentary—not just economic data.
For us, it’s a reminder that price stability is just one part of the equation. Policy stability matters, too. And during periods of perceived policy instability, volatility may follow.
The Top Instant Income Opportunities This Week
Below you will find the top trade candidates identified by the Income Trader Volatility (ITV) indicator. Each of these trades recommends selling (to open) a put option. If you’re looking to make additional Instant Income trades, I can’t think of a better list of stocks to start your research.
Bonus trades have less stringent risk parameters, and these trades have slightly more risk than trades I recommend for the Income Trader portfolio. Risk is still relatively low in a bonus trade, but it is not low enough to pass my most rigorous screens. We recommend closing all bonus trades when they trade at $ 0.10 or below.
I always recommend the use of limit orders when entering an options trade. A limit at the midpoint between the bid and ask prices will often be filled fairly quickly.
The charts below show this week’s top candidates: In the upper section of each chart, you can see the stock’s weekly price movement; in the bottom section, you’ll see the stock’s ITV (red line) and the ITV’s 20-week moving average (blue line).


Good Trading,
August 13, 2025 - 9:12 am
Interpreting CPI: The Numbers Say One Thing. The Market Says Another.
The latest Consumer Price Index (CPI) report arrived with no major surprises, headline and core inflation came in right around expectations. But if you looked at the headlines that followed, you’d think we were dealing with two different reports.
One emphasized “sticky” price pressures. Another highlighted continued progress toward the Federal Reserve’s inflation target. Both technically accurate. Both pulling in different directions.
The market’s response was more decisive: stocks and bonds rallied, and rate cut expectations ticked higher. Why? Because in a momentum-driven market, meeting expectations is often good enough.
Traders weren’t looking for a major downside surprise, they just didn’t want worse-than-expected.
From a volatility standpoint, this is a useful reminder. When inflation prints come in close to consensus, it tends to calm markets, even if the underlying data still suggests persistent inflation.
This can suppress implied volatility and keep premiums in check, especially if rate expectations drift further into “cut territory.”
But the bond market told a more complex story. Short-term yields dipped on rate cut optimism, while longer-term yields reversed higher, steepening the curve again.
That’s a signal of some internal push-pull: policy optimism on one end, concern about long-term inflation dynamics on the other.
Data moves expectations. Reactions move premium. The gap between them? That’s where we get paid.
The Top Instant Income Opportunities This Week
Below you will find the top trade candidates identified by the Income Trader Volatility (ITV) indicator. Each of these trades recommends selling (to open) a put option. If you’re looking to make additional Instant Income trades, I can’t think of a better list of stocks to start your research.
Bonus trades have less stringent risk parameters, and these trades have slightly more risk than trades I recommend for the Income Trader portfolio. Risk is still relatively low in a bonus trade, but it is not low enough to pass my most rigorous screens. We recommend closing all bonus trades when they trade at $ 0.10 or below.

I always recommend the use of limit orders when entering an options trade. A limit at the midpoint between the bid and ask prices will often be filled fairly quickly.
The charts below show this week’s top candidates: In the upper section of each chart, you can see the stock’s weekly price movement; in the bottom section, you’ll see the stock’s ITV (red line) and the ITV’s 20-week moving average (blue line).


Good Trading,
August 6, 2025 - 12:51 pm
Update: Correct JNJ Put Trade for This Week
Dear Subscribers,
In this week’s issue, there was an error in the trade table for Johnson & Johnson (JNJ). The trade was incorrectly listed as:
Sell JNJ $ 185 Puts at $ 0.55
There are no $ 185 puts available. The correct trade should be:
Sell JNJ $ 155 Puts at $ 0.45

I apologize for the oversight and appreciate your understanding.
Good Trading,
August 6, 2025 - 8:00 am
What Happens When the Messenger Gets Fired?
The week began with a jolt. After a surprise downward revision in the U.S. jobs report erased two months of job gains, the head of the government agency responsible for compiling that data was publicly dismissed.
This move raises important questions about transparency and trust in economic reporting. While the numbers themselves shocked markets, especially given how consistently the labor market had been beating expectations in prior months, the underlying cause may be more about deteriorating survey participation than any deliberate manipulation.
With response rates to government surveys reportedly down to about 60% (from 85–90% historically), data gaps are becoming harder to ignore. It appears those who were hiring submitted their reports, while those laying off may not have. Which is a timing issue that drastically skewed the result.
This isn’t just a headline. It matters for traders. Markets rely on clean, reliable data. If the integrity of that data becomes a political football, it introduces uncertainty that’s hard to price in. And it doesn’t stop at jobs. The same agency also compiles inflation data, data the Fed watches closely.
When credibility erodes, so does confidence in monetary policy.
Meanwhile, economic signals remain mixed. Some indicators, like the ADP payroll report, have been more consistent than government releases, suggesting a flat labor market over the past six months.
And yet, stocks continue to rally, even as bond yields and currencies hold their ground. That disconnect between equity markets and everything else might not be sustainable.
We’re also seeing a bifurcated market: mega-cap tech is thriving, but consumer discretionary and travel sectors are showing cracks. And if rate cuts do arrive sooner than expected, the “why” matters.
Cuts tied to falling inflation are one thing. Cuts made in response to a weakening economy are another.
For us, this environment requires both skepticism and discipline. The path of least resistance may be up, but under the surface, volatility is simmering. And when data gets politicized, all bets are off.
The Top Instant Income Opportunities This Week
Below you will find the top trade candidates identified by the Income Trader Volatility (ITV) indicator. Each of these trades recommends selling (to open) a put option. If you’re looking to make additional Instant Income trades, I can’t think of a better list of stocks to start your research.
Bonus trades have less stringent risk parameters, and these trades have slightly more risk than trades I recommend for the Income Trader portfolio. Risk is still relatively low in a bonus trade, but it is not low enough to pass my most rigorous screens. We recommend closing all bonus trades when they trade at $ 0.10 or below.

I always recommend the use of limit orders when entering an options trade. A limit at the midpoint between the bid and ask prices will often be filled fairly quickly.
The charts below show this week’s top candidates: In the upper section of each chart, you can see the stock’s weekly price movement; in the bottom section, you’ll see the stock’s ITV (red line) and the ITV’s 20-week moving average (blue line).


Good Trading,
July 30, 2025 - 7:00 am
What a CIA Analyst Taught Me About Trading
When I was training to become an intelligence analyst in the Army, one of the foundational texts we studied was the work of Richards Heuer, specifically his research on how cognitive biases distort the way we interpret complex information.
For context, Richards Heuer was a former CIA analyst and one of the most influential thinkers in modern intelligence tradecraft. His work became required reading across U.S. intelligence agencies because he focused not just on information gathering, but on how analysts think, and where thinking can go wrong.
Heuer didn’t just write about psychology, he focused on real-world decision-making under uncertainty. And, as it turns out, that’s exactly the environment we trade in every day.
He made three key points that have stuck with me ever since:
First, the human mind isn’t wired to handle uncertainty well, especially in complex or deceptive environments. In markets, that looks like misleading narratives, headline whiplash, and false signals.
Second, just being aware of bias isn’t enough. You can’t will yourself into being objective. We still tend to favor confirming evidence and ignore what contradicts our expectations.
Third, the best way to reduce bias is to use structured tools and systems, frameworks that help challenge assumptions, surface alternatives, and clarify what’s actually there.
That’s exactly what the ITV indicator is for.
I developed ITV to help me think clearly under pressure. It’s not about gut feel. It’s about identifying when the market is mispricing risk, even when it doesn’t look obvious on the chart.
The system keeps us disciplined. That’s what it was built for. Let’s take a look at what it’s showing us this week.
The Top Instant Income Opportunities This Week
Below you will find the top trade candidates identified by the Income Trader Volatility (ITV) indicator. Each of these trades recommends selling (to open) a put option. If you’re looking to make additional Instant Income trades, I can’t think of a better list of stocks to start your research.
Bonus trades have less stringent risk parameters, and these trades have slightly more risk than trades I recommend for the Income Trader portfolio. Risk is still relatively low in a bonus trade, but it is not low enough to pass my most rigorous screens. We recommend closing all bonus trades when they trade at $ 0.10 or below.

I always recommend the use of limit orders when entering an options trade. A limit at the midpoint between the bid and ask prices will often be filled fairly quickly.
The charts below show this week’s top candidates: In the upper section of each chart, you can see the stock’s weekly price movement; in the bottom section, you’ll see the stock’s ITV (red line) and the ITV’s 20-week moving average (blue line).


Good Trading,
July 23, 2025 - 7:00 am
Chasing the Crowd: Newton, FOMO, and What Markets Still Reveal
The fear of missing out, what we now casually call FOMO, has been part of human nature long before anyone gave it a catchy name. It taps into something timeless: the desire to act, to belong, to not be the one left behind while others appear to surge ahead.
Even history’s greatest minds weren’t immune. Isaac Newton, one of the most disciplined thinkers in history, got caught in the South Sea Bubble, not because he lacked intelligence, but because emotion overtook logic.
His story is a perfect reminder that fear and greed aren’t modern inventions. They’ve always been in the market, and they always leave clues.
Back in the early 1700s, the South Sea Company captured the public’s imagination. Its mission was ambitious: take over Britain’s national debt and open up trade with South America.
The promise of untold riches sent stock prices soaring. Newton, ever the rational observer, initially made a sound trade. He bought early, sold early, and walked away with a profit. And then he watched.
As prices kept climbing and friends grew richer, reason gave way to emotion. Newton reentered the trade, this time late, this time big—and got caught in the collapse. When the bubble burst, it reportedly cost him over £20,000, a financial disaster in his time.

His famous quote, “I can calculate the motion of heavenly bodies, but not the madness of people,” sums up exactly why this matters. Even the best minds are vulnerable when emotion overtakes discipline.
FOMO isn’t just about greed. It’s about comparison. Watching others succeed, especially when success looks easy or guaranteed, triggers that deep internal pressure to act. Logic fades. Urgency rises. Even Newton wasn’t immune. And neither is anyone else.
I’m not Newton, but I’ve always been guided by his wisdom, particularly his reminder that progress often comes from building on the work of those before us.
That’s exactly what I’ve tried to do in the markets. I’ve studied how investors behave, not what they say, but what they do. Because the truth is, behavior leaves a trail. If they’re bullish, they buy. If they’re scared, they sell. We can see it, clear as day, in the price action.
One of the more consistent patterns I’ve found is this: most of the meaningful market activity happens near the end of the trading day.
This isn’t opinion, it’s backed by studies from the exchanges. That data point, combined with the directional nature of price trends, gave me the foundation for a signal I use often.
In uptrends, price tends to close near the highs. In downtrends, it tends to close near the lows. Simple, but powerful.
I built my indicator around this tendency, then added another layer: I apply an indicator to the indicator.
That’s where Bollinger Bands come in. These bands don’t just show price extremes, they can also show when indicators themselves reach unusual levels.
What I found is this: when my indicator dips below its lower Bollinger Band, something interesting happens. That’s often when FOMO starts building, not the peak euphoria, but the moment when doubt and hesitation create the setup for the next move.
Not every signal is perfectly timed. Not every trade is a winner. But this approach has proven effective over time, and it’s one I’m watching closely in the current environment.
FOMO is as old as speculation itself. Newton’s story proves that it doesn’t matter how smart or experienced you are, emotion will always test your discipline. But while human behavior repeats, so do its patterns. That’s where opportunity lies.
By focusing on behavior, and by using tools that highlight when emotion is distorting price, we can position ourselves with reason instead of reaction.
That’s what my indicator is built to do. It helps keep us grounded, especially when the crowd starts to run.
The Top Instant Income Opportunities This Week
Below you will find the top trade candidates identified by the Income Trader Volatility (ITV) indicator. Each of these trades recommends selling (to open) a put option. If you’re looking to make additional Instant Income trades, I can’t think of a better list of stocks to start your research.
Bonus trades have less stringent risk parameters, and these trades have slightly more risk than trades I recommend for the Income Trader portfolio. Risk is still relatively low in a bonus trade, but it is not low enough to pass my most rigorous screens. We recommend closing all bonus trades when they trade at $ 0.10 or below.

I always recommend the use of limit orders when entering an options trade. A limit at the midpoint between the bid and ask prices will often be filled fairly quickly.
The charts below show this week’s top candidates: In the upper section of each chart, you can see the stock’s weekly price movement; in the bottom section, you’ll see the stock’s ITV (red line) and the ITV’s 20-week moving average (blue line). These charts usually show several previous signals and could help subscribers evaluate how successful signals were in the past.


Good Trading,
July 16, 2025 - 7:00 am
The Disconnect That’s Paying Us
This month’s CPI report came in largely as expected, offering short-term reassurance that inflation pressures remain manageable, at least by the numbers.
Headline inflation rose 0.3 percent month-over-month and 2.7 percent year-over-year, both in line with expectations.
The core reading, which excludes food and energy, increased 0.2 percent on the month and 2.9 percent year-over-year—slightly cooler than forecasts. That softer core reading nudged market expectations for a potential rate cut somewhat higher.
But looking beneath the surface, the drivers of inflation tell a more detailed story.
Increases in categories like medical care, dining out, and apparel suggest consumer demand remains strong, not that inflation is broadly weakening. Gasoline and energy services also posted notable monthly gains, signaling potential persistence in key cost components.
With tariff impacts still unfolding and core inflation holding near 3 percent, it’s understandable that the Fed remains in wait-and-see mode. Powell’s cautious tone isn’t just rhetoric, it reflects what the data shows.
And that’s exactly why the market’s reaction matters more than the print itself.
Investors are rotating into growth stocks and pricing in future rate cuts, as if inflation is definitively cooling. Meanwhile, several components of the CPI report are showing renewed upward pressure. That disconnect is creating inflated premiums in technically stable names, a favorable setup for put sellers.
We’ve seen this kind of pattern before, particularly during the last round of tariff-driven inflation in 2018 and 2019. CPI approached 3 percent, market expectations pulled away from the Fed’s message, and premiums expanded. Disciplined option sellers were rewarded.
It’s no different now.
We’re identifying premium-rich setups in fundamentally sound names, while the broader market prices in a version of the future that may not hold.
Let’s break down this week’s best opportunities.
The Top Instant Income Opportunities This Week
Below you will find the top trade candidates identified by the Income Trader Volatility (ITV) indicator. Each of these trades recommends selling (to open) a put option. If you’re looking to make additional Instant Income trades, I can’t think of a better list of stocks to start your research.
Bonus trades have less stringent risk parameters, and these trades have slightly more risk than trades I recommend for the Income Trader portfolio. Risk is still relatively low in a bonus trade, but it is not low enough to pass my most rigorous screens. We recommend closing all bonus trades when they trade at $ 0.10 or below.

I always recommend the use of limit orders when entering an options trade. A limit at the midpoint between the bid and ask prices will often be filled fairly quickly.
The charts below show this week’s top candidates: In the upper section of each chart, you can see the stock’s weekly price movement; in the bottom section, you’ll see the stock’s ITV (red line) and the ITV’s 20-week moving average (blue line). These charts usually show several previous signals and could help subscribers evaluate how successful signals were in the past.


Good Trading,

July 9, 2025 - 10:00 am
What Tariff Deadlines Teach Us About Volatility and Complacency
Another policy deadline hit the headlines last week. A proposed round of tariffs is scheduled to begin August 1. Markets didn’t blink.
That’s not because tariffs don’t matter. It’s because traders have learned to expect flexibility. In fact, the phrase “firm but not 100 percent firm” has been repeated enough that many assume delays or revisions are part of the process.
This kind of market behavior is important to understand, not because we’re taking sides on trade policy, but because it impacts how volatility is priced and how risk is managed.
Markets have seen this before: bold policy headlines followed by walk-backs, revisions, or delays. Over time, this conditions traders to expect reversals. When a headline drops, their first instinct isn’t to hedge, it’s to wait.
This is a textbook example of how expectations shape volatility. When uncertainty feels temporary or optional, the market stops reacting. Implied volatility doesn’t expand. Option premiums stay contained. And the reflex becomes: wait it out, buy the dip.
This complacency can create challenges and opportunities.
When the market shrugs off risks, implied volatility stays low, even if actual policy outcomes could have real economic effects. That can lead to lower premiums in the near term, mispriced risk over the medium term, and sudden volatility spikes when the market is finally forced to care.
For us, that means being selective. It’s tempting to ignore the headlines. But the better approach is to recognize when the market is underpricing real uncertainty. When premiums are thin, you don’t stretch. You wait for setups where the edge is clear.
Right now, the market is operating with a short memory. Dips are shallow. Rebounds are fast. The “buy the dip” mentality remains strong across a wide range of names.
But nothing works forever. And the more investors believe every policy headline will be reversed or softened, the more likely they are to be caught off guard when one isn’t.
We don’t sell puts just because the market is quiet. We sell puts when the premium justifies the risk and our indicator confirms the setup. That discipline matters more when others are relying on luck.
The Top Instant Income Opportunities This Week
Below you will find the top trade candidates identified by the Income Trader Volatility (ITV) indicator. Each of these trades recommends selling (to open) a put option. If you’re looking to make additional Instant Income trades, I can’t think of a better list of stocks to start your research.
Bonus trades have less stringent risk parameters, and these trades have slightly more risk than trades I recommend for the Income Trader portfolio. Risk is still relatively low in a bonus trade, but it is not low enough to pass my most rigorous screens. We recommend closing all bonus trades when they trade at $ 0.10 or below.
I always recommend the use of limit orders when entering an options trade. A limit at the midpoint between the bid and ask prices will often be filled fairly quickly.
The charts below show this week’s top candidates: In the upper section of each chart, you can see the stock’s weekly price movement; in the bottom section, you’ll see the stock’s ITV (red line) and the ITV’s 20-week moving average (blue line). These charts usually show several previous signals and could help subscribers evaluate how successful signals were in the past.


Good Trading,
July 2, 2025 - 7:00 am
Big Bill, Soft Earnings: The Setup Beneath the Surface
As you probably know, the Senate just passed what’s being called the “One Big Beautiful Bill”, a piece of legislation that touches nearly every corner of the economy, from taxes and spending to the debt ceiling.
Vice President J.D. Vance cast the tie-breaking vote to send the bill back to the House for final approval, with President Trump pushing for it to be signed by July 4th.
The bill makes the 2017 tax cuts permanent, expands the standard deduction, adds targeted tax relief for tips, overtime, seniors, and car loan interest, and increases spending on defense and immigration enforcement.
It also eliminates most green energy tax credits, applies a new remittance tax, and imposes work requirements for safety net programs like Medicaid and SNAP.
For traders, this is more than just politics. The bill lifts the debt ceiling by trillion, sidestepping a default risk that had been looming this summer. That alone can calm markets in the short term and reduce headline-driven volatility.
But longer term, a projected .3 trillion increase to the national debt raises serious questions about deficits, inflation, and the Fed’s next move.
The timing matters too. Earnings season kicks off soon, and expectations are already being revised lower. S&P 500 earnings are projected to rise just 5% year over year in Q2, down from 13.3% in Q1.
Several sectors are expected to report declines, and higher tariffs could pressure profit margins further, especially if companies are absorbing costs instead of passing them on.
That could weigh on earnings and, eventually, on forward guidance. On the other hand, a weakening dollar may offer a boost for multinationals, so early estimates may prove too conservative.
Meanwhile, industrials are quietly leading the 2025 sector scoreboard, up nearly 12% year to date.
With increased defense and manufacturing spending baked into the bill, the strength in names like GE, CAT, RTX, and HON may be signaling something broader: growing investor confidence in U.S. infrastructure and production capacity.
For us, this legislation brings a few things into focus. In the short term, we may see a dip in volatility now that the debt ceiling crisis is off the table.
But the longer-term effects, more government spending, rising deficits, and potentially delayed rate cuts, could keep a layer of uncertainty beneath the surface.
As I say each week, no matter what’s going on around us, we’ll rely on our indicator to identify trades. This week, there were only two signals, and I’ve shared both with you.
Since we don’t trade through earnings, our selection is more limited right now, but I’ll continue monitoring for new opportunities.
The Top Instant Income Opportunities This Week
Below you will find the top trade candidates identified by the Income Trader Volatility (ITV) indicator. Each of these trades recommends selling (to open) a put option. If you’re looking to make additional Instant Income trades, I can’t think of a better list of stocks to start your research.
Bonus trades have less stringent risk parameters, and these trades have slightly more risk than trades I recommend for the Income Trader portfolio. Risk is still relatively low in a bonus trade, but it is not low enough to pass my most rigorous screens. We recommend closing all bonus trades when they trade at $ 0.10 or below.

I always recommend the use of limit orders when entering an options trade. A limit at the midpoint between the bid and ask prices will often be filled fairly quickly.
The charts below show this week’s top candidates: In the upper section of each chart, you can see the stock’s weekly price movement; in the bottom section, you’ll see the stock’s ITV (red line) and the ITV’s 20-week moving average (blue line). These charts usually show several previous signals and could help subscribers evaluate how successful signals were in the past.


Good Trading,
June 25, 2025 - 6:00 am
The Discipline of Seeing What Others Miss
As many of you know, I was an intelligence analyst. My job was to interpret patterns in unpredictable environments, stay focused under pressure, and help decision-makers act on facts.
That mindset still guides everything I do. I don’t trade headlines. I analyze what they mean and what’s missing.
This week, that discipline matters more than ever.
Earlier this week, markets pushed higher after geopolitical concerns eased slightly and Fed Chair Jerome Powell reiterated the Fed’s “wait-and-see” stance.
Oil dropped sharply, the dollar softened, and growth sectors, particularly tech and consumer discretionary, continued to lead.
In testimony before Congress, Powell emphasized the Fed’s commitment to managing inflation, which he expects to drift slightly higher in May.
He noted that tariffs remain a wildcard, and said the Fed will likely hold rates steady until it better understands their long-term effects. His tone was cautious but steady, and he made clear that the central bank isn’t rushing to make changes without more data.
Internally, Fed officials remain split. Some see no cuts this year. Others see one or two. And a few voting members have floated the possibility of easing as early as July, if inflation continues to behave.
The result? Conflicting signals, rising uncertainty, and growing divergence between what the Fed says and what the market expects.
That combination is creating a sweet spot for those of us selling puts, as short-dated options are offering elevated premiums in stocks that are still trending higher or trading in stable ranges.
We’re seeing it across several sectors in names that are recovering while implied volatility stays elevated. These are the moments that reward selective entries and precise risk control.
The Top Instant Income Opportunities This Week
Below you will find the top trade candidates identified by the Income Trader Volatility (ITV) indicator. Each of these trades recommends selling (to open) a put option. If you’re looking to make additional Instant Income trades, I can’t think of a better list of stocks to start your research.
Bonus trades have less stringent risk parameters, and these trades have slightly more risk than trades I recommend for the Income Trader portfolio. Risk is still relatively low in a bonus trade, but it is not low enough to pass my most rigorous screens. We recommend closing all bonus trades when they trade at $ 0.10 or below.

I always recommend the use of limit orders when entering an options trade. A limit at the midpoint between the bid and ask prices will often be filled fairly quickly.
The charts below show this week’s top candidates: In the upper section of each chart, you can see the stock’s weekly price movement; in the bottom section, you’ll see the stock’s ITV (red line) and the ITV’s 20-week moving average (blue line). These charts usually show several previous signals and could help subscribers evaluate how successful signals were in the past.

Good Trading,
June 18, 2025 - 7:00 am
Markets Are on Defense, But That’s Where We Do Our Best Work
Markets have been on edge since President Trump abruptly left an economic meeting to address rising tensions in the Middle East, specifically calling for the evacuation of Tehran.
That headline alone was enough to rattle investors. Oil jumped, Treasury yields dropped, and capital rotated into defense mode almost instantly.
It’s the kind of environment where implied volatility jumps, not because fundamentals are breaking down, but because fear is being priced in faster than facts can catch up.
Crude bounced nearly 2%. The VIX jumped almost 5%. And Treasury yields dropped, with the 10-year falling to 4.40% as capital moved toward perceived safety.
For us, this is a moment worth watching closely.
At the same time, the Fed kicked off its two-day policy meeting, and the May retail sales report landed with a thud. Headline sales dropped 0.9%, well below expectations for a 0.6% decline. Excluding autos, sales fell 0.3%. April’s numbers were also revised lower.
But here’s where it gets interesting: the retail control group, the component that directly feeds into GDP, rose 0.4% vs. the 0.3% expectation. In other words, while the headline made for an ugly number, the data beneath the surface wasn’t nearly as weak.
This is why we don’t just trade the headlines.
The selloff in autos may have been driven more by buyers pulling demand forward ahead of tariff changes, not by collapsing consumer sentiment.
Even restaurant and bar sales, which fell 0.9%, may reflect a tightening in discretionary spending, something we’ve been anticipating as the services side of the economy begins to slow.
And while no rate move is expected from the Fed this week, the real focus will be on the updated economic projections. The question is whether they’ll stick with their forecast of two rate cuts for 2025, or revise that lower.
Right now, markets are pricing in just a 14.5% chance of a July cut, and 66% odds for a September cut, numbers that could shift depending on the tone of Powell’s remarks.
Also worth watching: jobless claims and the Treasury International Capital (TIC) report.
Claims have been trending higher, from ~220,000 to ~250,000 in the last three weeks, and we’ve seen nearly 700,000 layoff announcements year-to-date, compared to 390,000 this time last year. That’s a signal the labor market may be cooling faster than it appears.
The TIC data, often overlooked, could also give us an early read on foreign appetite for U.S. assets in the wake of rising trade tensions.
If demand for Treasuries starts to waver, especially in the context of a projected deficit nearing 7% of GDP, yields could become even more reactive in the months ahead.
All of this adds up to one thing: uncertainty is back, and that tends to benefit disciplined put sellers.
Premiums are perking up. Sector rotation is uneven. And while headline volatility may be driving quick reactions, the underlying data remains mixed, which means we’ll continue to see short bursts of fear, but not necessarily a change in trend.
The Top Instant Income Opportunities This Week
Below you will find the top trade candidates identified by the Income Trader Volatility (ITV) indicator. Each of these trades recommends selling (to open) a put option. If you’re looking to make additional Instant Income trades, I can’t think of a better list of stocks to start your research.
Bonus trades have less stringent risk parameters, and these trades have slightly more risk than trades I recommend for the Income Trader portfolio. Risk is still relatively low in a bonus trade, but it is not low enough to pass my most rigorous screens. We recommend closing all bonus trades when they trade at $ 0.10 or below.
I always recommend the use of limit orders when entering an options trade. A limit at the midpoint between the bid and ask prices will often be filled fairly quickly.
The charts below show this week’s top candidates: In the upper section of each chart, you can see the stock’s weekly price movement; in the bottom section, you’ll see the stock’s ITV (red line) and the ITV’s 20-week moving average (blue line). These charts usually show several previous signals and could help subscribers evaluate how successful signals were in the past.


Good Trading,
June 11, 2025 - 7:00 am
What a “Strong” Jobs Report Isn’t Telling Us
Markets rallied on last Friday’s jobs report. The S&P 500 rose 1%, and 10-year Treasury yields climbed from 4.40% to 4.51%, as headlines pointed to stronger-than-expected job growth and a steady unemployment rate. Payrolls increased by 139,000 in May, beating the 125,000 estimate.
On the surface, it looked like confirmation that the economy remains solid despite higher rates.
But under the surface, the data tells a more cautious story.
Job gains from March and April were revised down by 95,000. That brings 2025’s average monthly job growth to 124,000—a clear drop from last year’s 168,000 pace.
The unemployment rate may have stayed at 4.2%, but the unrounded number rose to 4.244%, with 71,000 more people now counted as unemployed, the highest total since October 2021.
The household survey added more signs of weakness. The civilian labor force shrank by 625,000, and employment fell by nearly 700,000. This isn’t a collapse, but it’s a meaningful slowdown that doesn’t show up in the headline numbers.
Other data reinforced the trend. Initial jobless claims rose to 247,000, and continuing claims stayed above 1.9 million. Small business hiring plans are near 10-year lows.
Layoff announcements remain elevated, with 94,000 job cuts in May, up 47% from a year ago. And wage data suggests actual job growth may be overstated, with downward revisions likely ahead.
This doesn’t point to a sharp downturn, but it does suggest a cooling economy.
Even so, the Fed isn’t likely to cut rates soon. Inflation pressures tied to tariffs are only starting to appear, and the consumption deflator could reach 3.5% by year-end, well above the Fed’s 2% target. At the same time, fiscal policy remains uncertain, with a new tax bill potentially adding more stimulus.
Immigration is also slowing, tightening the labor pool and keeping upward pressure on wages. And with markets back at all-time highs, the Fed has little incentive to act now.
For put sellers, this is a favorable setup. The economy is slowing, not breaking, an environment that tends to produce short bursts of volatility, especially in names that disappoint or get caught in sentiment shifts.
With the Fed sidelined and inflation still sticky, investors are adjusting their expectations. That uncertainty is where we find premium worth selling.
This isn’t a market in crisis. It’s one in transition. And transitions often bring just enough fear to open the door.

T-Mobile US, Inc. (TMUS): continues to trade above our strike price and is on track to deliver a gain next month.
The Top Instant Income Opportunities This Week
Below you will find the top trade candidates identified by the Income Trader Volatility (ITV) indicator. Each of these trades recommends selling (to open) a put option. If you’re looking to make additional Instant Income trades, I can’t think of a better list of stocks to start your research.
Bonus trades have less stringent risk parameters, and these trades have slightly more risk than trades I recommend for the Income Trader portfolio. Risk is still relatively low in a bonus trade, but it is not low enough to pass my most rigorous screens. We recommend closing all bonus trades when they trade at $ 0.10 or below.

I always recommend the use of limit orders when entering an options trade. A limit at the midpoint between the bid and ask prices will often be filled fairly quickly.
The charts below show this week’s top candidates: In the upper section of each chart, you can see the stock’s weekly price movement; in the bottom section, you’ll see the stock’s ITV (red line) and the ITV’s 20-week moving average (blue line).


Good Trading,
June 4, 2025 - 7:00 am
What Rising Yields Are Really Telling Us
This week, I came across several commentaries that echoed what many of us have been feeling: the climb in long-term yields isn’t just about inflation anymore, it’s about risk.
Investor demands for higher returns on long-term debt are rising as concerns over U.S. fiscal sustainability grow. A projected deficit near 7% of GDP, increased Treasury issuance, and the threat of credit rating downgrades are all feeding into a very real repricing of long-duration risk.
Here’s what that means in plain terms: the bond market is no longer operating on yesterday’s assumptions. It’s adjusting, and that shift is rippling across everything from equity valuations to sector rotation and, of course, option pricing.
What’s interesting is where the disconnect lies. While headlines zero in on 10-year yields creeping toward uncomfortable levels, equity markets have been surprisingly resilient. Tech bounced. Small caps showed life. Volatility remains relatively muted. That tells us the story isn’t as simple as “rates up, stocks down.”
This kind of dislocation, where market narratives and price action don’t align, often creates opportunity. For us, it means short bursts of premium expansion without a major trend shift.
We’re not changing our strategy. But we are watching the pressure points, especially in interest-rate-sensitive names, small caps, and sectors tied to macro confidence.
 The Top Instant Income Opportunities This Week
 The Top Instant Income Opportunities This Week
Below you will find the top trade candidates identified by the Income Trader Volatility (ITV) indicator. Each of these trades recommends selling (to open) a put option. If you’re looking to make additional Instant Income trades, I can’t think of a better list of stocks to start your research.
Bonus trades have less stringent risk parameters, and these trades have slightly more risk than trades I recommend for the Income Trader portfolio. Risk is still relatively low in a bonus trade, but it is not low enough to pass my most rigorous screens. We recommend closing all bonus trades when they trade at $ 0.10 or below.

I always recommend the use of limit orders when entering an options trade. A limit at the midpoint between the bid and ask prices will often be filled fairly quickly.
The charts below show this week’s top candidates: In the upper section of each chart, you can see the stock’s weekly price movement; in the bottom section, you’ll see the stock’s ITV (red line) and the ITV’s 20-week moving average (blue line). These charts usually show several previous signals and could help subscribers evaluate how successful signals were in the past.


Good Trading,
May 28, 2025 - 7:00 am
Why the Market Feels Worse Than It Looks
There’s still a clear gap between how people feel about the economy and what the numbers say. Consumer confidence remains low. Small business optimism has faded. Forward guidance from major companies has been pulled or cut back. But hard data, things like job growth, retail spending, and industrial output, has held up.
That split between sentiment and actual economic output has made it harder to get a clean read on where we really are in the cycle.
In economic terms, this is the difference between soft data and hard data. Soft data reflects expectations and attitudes. It’s how people and businesses say they’re feeling.
Hard data tracks what they’re doing. Lately, the two have been heading in different directions. Surveys show that many consumers are still worried about inflation and jobs, even though the labor market remains strong and the Consumer Price Index has been slowing.
Some of the pressure on soft data seems tied to ongoing uncertainty around trade policy, tariffs, and the broader geopolitical climate. Businesses are trying to plan without knowing what the rules might look like in a few months. Consumers are still adjusting to higher prices on everyday goods.
And that uncertainty shows up in their responses.
Even in areas like inflation expectations, there’s a gap. Short-term and long-term expectations have both moved higher, while actual core inflation has been easing. The same goes for the Misery Index. The traditional version, based on actual unemployment and inflation rates, has stayed low.
But when measured by how people expect those numbers to change, the index moves sharply higher. It’s another example of perception outpacing reality.
In some cases, soft data does lead the hard data lower. It can act as an early warning sign, especially when uncertainty lingers. In other cases, sentiment improves as policy becomes clearer and the hard data continues to hold.
Right now, we’re still in between. The economy is still functioning, but many people don’t feel like it is.
For investors, this kind of environment tends to feel unstable. But that doesn’t mean it has to be unmanageable. When sentiment is this uncertain and hard data is still holding up, it helps to focus on consistency. Which is exactly what we do each week.

The Top Instant Income Opportunities This Week
Below you will find the top trade candidates identified by the Income Trader Volatility (ITV) indicator. Each of these trades recommends selling (to open) a put option. If you’re looking to make additional Instant Income trades, I can’t think of a better list of stocks to start your research.
Bonus trades have less stringent risk parameters, and these trades have slightly more risk than trades I recommend for the Income Trader portfolio. Risk is still relatively low in a bonus trade, but it is not low enough to pass my most rigorous screens. We recommend closing all bonus trades when they trade at $ 0.10 or below.

I always recommend the use of limit orders when entering an options trade. A limit at the midpoint between the bid and ask prices will often be filled fairly quickly.
The charts below show this week’s top candidates: In the upper section of each chart, you can see the stock’s weekly price movement; in the bottom section, you’ll see the stock’s ITV (red line) and the ITV’s 20-week moving average (blue line).


Good Trading,
May 21, 2025 - 7:00 am
The Hidden Risk in “Safe” Portfolios
This past weekend, I took my kids to the beach. It’s something we do every year while visiting my family down south.
The kids get to spend time with their grandparents and play in the ocean. And I get to sit on the porch and listen to my folks tell me what their friend’s son, the one who’s a financial adviser, has to say about the market.
“Options are too risky and he only trades stocks,” he says.
I wish I had a dollar for every time someone tried to tell me that options are too risky. Every time I hear it, I think, the real question people should ask is: Why not?
That question usually reveals a common misconception. Many people assume options are inherently risky. They can be, but that depends entirely on how they’re used.
What most investors don’t realize is that the traditional “buy and hold” strategy can carry far more risk than they’re aware of. In fact, many so called conservative investors are exposed to levels of risk I actively avoid.
Take a typical buy and hold investor. They may own blue chip stocks, dividend payers, or low fee index funds. They’re often told they’re playing it safe. But if the S&P 500 falls 50%, most of these portfolios are built to fall with it. That’s not risk management, that’s risk acceptance.
The problem is that these investors often measure safety with misunderstood metrics. Low beta stocks, for example, are designed to move less than the market. But in a bear market, that just means they lose a little less.
Over time, these portfolios tend to underperform. And while they may be labeled “lower risk,” the truth is that volatility (often defined by standard deviation) doesn’t pay the bills.
Your bank doesn’t accept deposits in standard deviations, only in dollars.
Long term investors also rely heavily on the idea that stocks “always come back.” That’s generally true for the market as a whole, but the timeline matters.
After the dot com bubble burst in 2000, it took more than 12 years for the S&P 500 to return to its previous highs. If you were planning to retire, send a child to college, or cover an unexpected expense during that period, the rebound didn’t come fast enough.

This is where options come in, not as a high-risk strategy, but as a disciplined, structured way to manage risk. I’m not comfortable sitting through a decade long drawdown.
That’s why I use strategies like put selling to generate income and protect capital, approaches that let me define risk in advance, adjust when conditions change, and stay in control.
The truth is, buy and hold works, until it doesn’t. And when it doesn’t, the consequences can be life altering. I’d rather avoid that.

The Top Instant Income Opportunities This Week
Below you will find the top trade candidates identified by the Income Trader Volatility (ITV) indicator. Each of these trades recommends selling (to open) a put option. If you’re looking to make additional Instant Income trades, I can’t think of a better list of stocks to start your research.
Bonus trades have less stringent risk parameters, and these trades have slightly more risk than trades I recommend for the Income Trader portfolio. Risk is still relatively low in a bonus trade, but it is not low enough to pass my most rigorous screens. We recommend closing all bonus trades when they trade at $ 0.10 or below.

I always recommend the use of limit orders when entering an options trade. A limit at the midpoint between the bid and ask prices will often be filled fairly quickly.
The charts below show this week’s top candidates: In the upper section of each chart, you can see the stock’s weekly price movement; in the bottom section, you’ll see the stock’s ITV (red line) and the ITV’s 20-week moving average (blue line).


Good Trading,
May 14, 2025 - 7:00 am
Controlled Chaos: What Smart Traders Are Watching Right Now
Last week, I shared the story about the gorilla in the CT scan and how focusing too narrowly can cause us to miss what’s right in front of us.
That idea has been top of mind lately as I watch the market’s recent behavior.
Take last week’s jobs report. The headlines were clear: payrolls came in hot, wage growth ticked up, and everyone started bracing for the Fed to keep rates higher for longer. Stocks dropped briefly.
But then something interesting happened. The Nasdaq rebounded fast. Small caps followed. Even some rate-sensitive sectors, the ones you’d expect to get hit hardest, caught a bid.
To someone locked into the “bad news equals bad market” script, that bounce might look like noise. But to me, it was a tell. Big money wasn’t selling into weakness. They were buying the dip.
It reminded me of something I learned during field training. Sometimes what looks like chaos is actually controlled movement. The trick is knowing what to trust and when.
This is exactly why we rely on our ITV indicator.
Most investors watch market-wide volatility like the VIX to decide whether the environment is good for selling options. But the ITV goes deeper. It measures volatility at the stock level. And that distinction matters.
While the VIX has been drifting sideways, ITV is showing something else entirely. Select stocks are experiencing localized surges in volatility, and that’s driving up premiums even in a low-VIX market.
That’s where the opportunity lives right now.
Instead of waiting for broad market fear to drive up prices, we’re identifying pockets of elevated individual-stock volatility and stepping in to sell puts when the risk and reward align.
It’s a cleaner, more precise way to trade. And more often than not, it keeps us one step ahead of the noise.
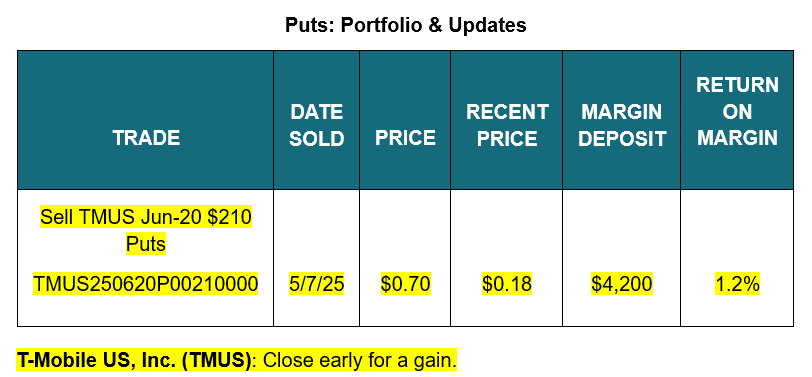
Puts: Portfolio & Updates

T-Mobile US, Inc. (TMUS): Is trading above our strike price and on track to deliver a gain next month.
The Top Instant Income Opportunities This Week
Below you will find the top trade candidates identified by the Income Trader Volatility (ITV) indicator. Each of these trades recommends selling (to open) a put option. If you’re looking to make additional Instant Income trades, I can’t think of a better list of stocks to start your research.
Bonus trades have less stringent risk parameters, and these trades have slightly more risk than trades I recommend for the Income Trader portfolio. Risk is still relatively low in a bonus trade, but it is not low enough to pass my most rigorous screens. We recommend closing all bonus trades when they trade at $ 0.10 or below.

I always recommend the use of limit orders when entering an options trade. A limit at the midpoint between the bid and ask prices will often be filled fairly quickly.
The charts below show this week’s top candidates: In the upper section of each chart, you can see the stock’s weekly price movement; in the bottom section, you’ll see the stock’s ITV (red line) and the ITV’s 20-week moving average (blue line). These charts usually show several previous signals and could help subscribers evaluate how successful signals were in the past.


Good Trading,
May 7, 2025 - 7:00 am
Trading Success Comes Down to These 4 Letters
For those of you who’ve been with me for a while, you’ve probably heard this story before. Still, I think it’s one worth repeating. It’s a reminder that’s just as important today as the first time I shared it.
In the Army, we lived by the phrase “Keep it simple, stupid,” or just “KISS.” Acronyms were everywhere, and this one stuck. Not because anyone was stupid, but because simplicity saves lives.
It’s a philosophy that works outside the military too. Albert Einstein once said, “Everything should be made as simple as possible, but not simpler.” If he’d been in my unit, I doubt anyone would’ve cared about his Nobel Prize. He would’ve been handed a helmet, a flak jacket, and a set of instructions that looked more like a comic book than a physics paper.
Why? Because when you’re in high-stakes situations, clarity is everything. The Army doesn’t assume you’ll have time to interpret dense manuals or overcomplicated instructions. They break things down so anyone can act quickly and confidently, no matter how complex the mission.
That mindset came back to me when I saw a study showing 83% of radiologists missed a gorilla in a lung CT scan. Yes, a gorilla. It was right there, a clearly out-of-place image in the upper right corner. But only 4 of 24 doctors noticed it.
 Source: NLM.gov
Why? Because they were told to focus on nodules. Their attention was so narrowly tuned that they missed the obvious. It’s not that they weren’t skilled, it’s that they were too specialized.
In contrast, the Army trains you to look for anything that seems off. You don’t always know what you’re looking for, but you’re trained to spot it anyway. You keep your head on a swivel. You simplify the mission, but you stay alert to what matters most.
Trading works the same way.
A lot of investors fall into the radiologist trap. They rely on one strategy or one indicator, believing that if they master it, they’ll always come out ahead. But markets are messy. Rigid focus can cause you to miss the gorilla, the obvious shift or risk that didn’t fit your model.
My trading style is rooted in what the Army taught me: Stay flexible. Use every tool available. Build a clear plan, and keep it simple enough that someone else could take over if you weren’t there. In the field, overcomplication isn’t just a bad habit — it’s a risk.
I’ve developed my own indicators and tools, and I know them inside and out. But I never ignore something just because it doesn’t fit the pattern. If something feels off, I investigate.
Because whether you’re on a mission or in the markets, success doesn’t come from being the smartest person in the room. It comes from seeing what’s really there, even when no one else does.
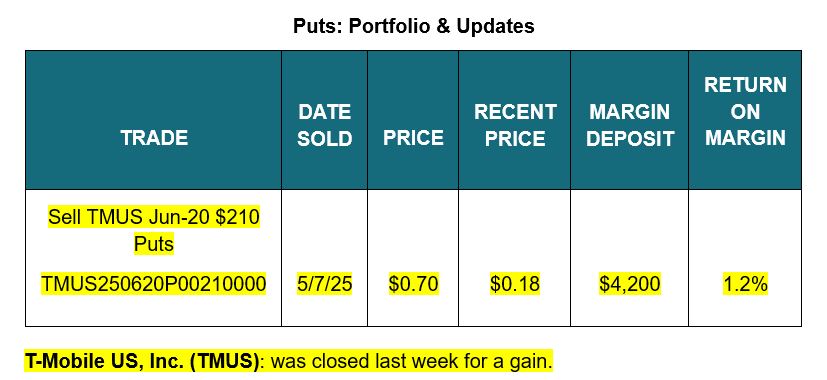
Today’s Trade: Generate 1.7% In TMUS
As I write this, TMUS is trading around $ 253.80. This week, I recommend selling (to open) TMUS June-20 $ 210 Puts for $ 0.70 – $ 0.95. That’s a put option on TMUS with a strike price of $ 210 that expires on June 20, 2025 (TMUS250620P00210000).

When entering the trade, I recommend using a limit order near or below the current ask price of the option. (A price quote will include a bid and ask price; trades are often completed between these two prices.)
For example, if the current quote on this option is “bid $ 0.60, ask $ 0.70,” I would suggest using a limit order to sell at $ 0.65. If that order is not filled within a few hours, you could lower the limit price based on the current quote. A limit order at this level will usually be filled quickly.
No matter what the current bid and ask prices are, I do not recommend trading outside the limit I set for the trade. For this trade, your limit price should be between $ 0.70 and $ 0.95.
As soon as your trade is executed, you will generate immediate income of about $ 70 (each contract controls 100 shares), assuming you enter the trade at the bottom of the range. (I’m using the bottom of the range because that’s the least amount of income we’ll accept for this trade, which gives us the most conservative estimate of our return.)
Selling this put will obligate you to buy TMUS at $ 210 a share if the stock trades for less than that on June 20th (the last day these options can be traded).
Buying 100 shares of TMUS at $ 210 each would cost $ 21,000. To initiate this trade, your broker will likely require you to deposit a percentage of that obligation in your account, like a down payment on a house.
This is called a “margin requirement.” It usually runs about 20% of the amount it would cost you to buy the shares. This TMUS trade would require a margin deposit of $ 4,200 (20% of $ 21,000).
Here’s how the trade looks if the option expires worthless:

Assuming TMUS trades for $ 210 or more on June 20th, we keep the premium and make a profit of $ 70 on $ 4,200, or 1.7%, in 44 days. If we can repeat a similar trade every 44 days, we will earn about 14.1% on our capital in 12 months.
Recommended Trade: Sell TMUS June-20 $ 210 Puts for $ 0.70 – $ 0.95. Remember, each option contract you sell represents a potential obligation to purchase 100 shares of TMUS. If you’re not comfortable owning more than 100 shares of TMUS, don’t sell more than one put.
I don’t recommend using a stop-loss on this trade. I will be monitoring it closely and will send an immediate update if anything changes.
As always, I recommend readers use limit orders to execute trades. If prices move and you can’t get the premium you want, don’t chase the trade. Income Trader is a weekly publication, so you’ll get plenty of opportunities to generate income selling puts.
The Top Instant Income Opportunities This Week
Below you will find the top trade candidates identified by the Income Trader Volatility (ITV) indicator. Each of these trades recommends selling (to open) a put option. If you’re looking to make additional Instant Income trades, I can’t think of a better list of stocks to start your research.
Bonus trades have less stringent risk parameters, and these trades have slightly more risk than trades I recommend for the Income Trader portfolio. Risk is still relatively low in a bonus trade, but it is not low enough to pass my most rigorous screens. We recommend closing all bonus trades when they trade at $ 0.10 or below.

I always recommend the use of limit orders when entering an options trade. A limit at the midpoint between the bid and ask prices will often be filled fairly quickly.
The charts below show this week’s top candidates: In the upper section of each chart, you can see the stock’s weekly price movement; in the bottom section, you’ll see the stock’s ITV (red line) and the ITV’s 20-week moving average (blue line). These charts usually show several previous signals and could help subscribers evaluate how successful signals were in the past.

Good Trading,
April 30, 2025 - 8:00 am
A Nod to a Wall Street Legend
Last week, a friend asked me about an old article I had written on Hetty Green and said it reminded her of a woman who owned her own firm. She said, “You know, the one with the TV commercials when we were little.” Without hesitation, I said, “Oh, that’s Muriel Siebert.”
It’s a name that I’ll always remember. As odd as it may sound, I recall reading her obituary and thinking of how my success was thanks to her and other women like her who challenged the status quo.
I remember thinking at that time that this was all so recent. It was only during my mother’s lifetime that women have become accepted on Wall Street.
To refresh my memory, I found that 2013 obituary. Muriel was the first woman to own a seat on the New York Stock Exchange. That was in 1967, 175 years after the exchange was founded.
It wasn’t easy. Other members had to sponsor your application to buy a seat. Nine of the first ten men she asked refused to sign her application.
Muriel also founded her own firm, Muriel Siebert & Co., Inc. Now it’s publicly traded at Siebert Financial Corp. (Nasdaq: SIEB), a small broker with a market cap of about million.
She wasn’t the first woman to own a broker. That honor seems to belong to Victoria Woodhull, a pioneer in the woman’s suffrage movement. She founded a firm with her sister in the 1870s.
That was long before we were watching Muriel Siebert on television. Now, no one really sees an analyst or a trader as a woman or a man. I like to think they see us our profit and loss statements.
My P&L statement will depend on getting the short-term trends right over the next few months. This is what I always do. At times like this, I am reminded of how glad I am I focus on the short term.
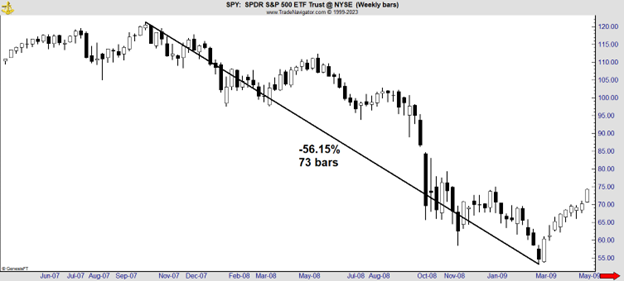
Especially when I think back on things like the subprime mortgage crisis in 2008 and how it became a global credit crisis. Massive government and central bank intervention kept the system functioning. But stocks fell sharply in a bear market that lasted 73 weeks.
In 1998, Long Term Capital Management collapsed. Traders were concerned about whether the crisis could be contained to the one fund. In the end, the crisis passed quickly and we saw new highs in the S&P 500 just three months after LTCM’s demise.

Despite all the recent noise and panic in the market, I’m hopeful that this will be like 1998. We’ll continue focusing on the short-term and locking in those steady, quick gains.
The Top Instant Income Opportunities This Week
Below you will find the top trade candidates identified by the Income Trader Volatility (ITV) indicator. Each of these trades recommends selling (to open) a put option. If you’re looking to make additional Instant Income trades, I can’t think of a better list of stocks to start your research.
Bonus trades have less stringent risk parameters, and these trades have slightly more risk than trades I recommend for the Income Trader portfolio. Risk is still relatively low in a bonus trade, but it is not low enough to pass my most rigorous screens. We recommend closing all bonus trades when they trade at $ 0.10 or below.
 I always recommend the use of limit orders when entering an options trade. A limit at the midpoint between the bid and ask prices will often be filled fairly quickly.
The charts below show this week’s top candidates: In the upper section of each chart, you can see the stock’s weekly price movement; in the bottom section, you’ll see the stock’s ITV (red line) and the ITV’s 20-week moving average (blue line). These charts usually show several previous signals and could help subscribers evaluate how successful signals were in the past.

Good Trading,
April 23, 2025 - 8:16 am
The Headlines Say One Thing. Price Says Another.
Lately, the financial headlines have been loud, and mostly negative. Talk of stagflation, geopolitical instability, tech layoffs, and rising debt burdens dominate the news cycle. You’d think we were on the verge of collapse. But if you take a closer look, the price action tells it’s own story.
This disconnect isn’t new. In fact, it’s a recurring theme in every market cycle: fear-based narratives often lag price reality. The media moves in response to what already happened, or worse, what feels like it’s about to happen. But price moves based on actual flows, positioning, and sentiment shifts that most headlines miss entirely.
That’s why we don’t trade based on news.
Our ITV indicator isn’t scanning headlines, it’s scanning volatility, trend persistence, and strength relationships across sectors. It watches what traders do, not what they say. Just recently, ITV gave us a high-probability setup in DoorDash (DASH). The news cycle was full of reasons to stay away, rising food delivery costs, consumer pullback, and fears about discretionary tech. But ITV didn’t care. It flagged an opportunity, and we followed the signal. That trade locked in a solid short-term gain, even as headlines told us not to touch it.
Here’s the truth: clarity is expensive. By the time a story is “confirmed,” the trade is gone.
That’s the edge of ITV. It doesn’t need a narrative. It finds setups rooted in structure, patterns that repeat when markets are uncertain, irrational, or even fearful.
So the next time a scary headline crosses your screen, take a breath. Then take a look at what the market is actually doing. Because price, like our ITV indicator, doesn’t lie.

DoorDash, Inc. (DASH) was closed last week for a gain.
The Top Instant Income Opportunities This Week
Below you will find the top trade candidates identified by the Income Trader Volatility (ITV) indicator. Each of these trades recommends selling (to open) a put option. If you’re looking to make additional Instant Income trades, I can’t think of a better list of stocks to start your research.
Bonus trades have less stringent risk parameters, and these trades have slightly more risk than trades I recommend for the Income Trader portfolio. Risk is still relatively low in a bonus trade, but it is not low enough to pass my most rigorous screens. We recommend closing all bonus trades when they trade at $ 0.10 or below.

I always recommend the use of limit orders when entering an options trade. A limit at the midpoint between the bid and ask prices will often be filled fairly quickly.
The charts below show this week’s top candidates: In the upper section of each chart, you can see the stock’s weekly price movement; in the bottom section, you’ll see the stock’s ITV (red line) and the ITV’s 20-week moving average (blue line). These charts usually show several previous signals and could help subscribers evaluate how successful signals were in the past.


Good Trading,
April 16, 2025 - 6:00 am
Global Markets: What Currency Moves Are Telling Us
In late February, global risk markets took a sharp dive, and many of the so-called “Trump trades” were swiftly reversed. The dollar wasn’t immune. While it held steady against some currencies, it weakened meaningfully against others, most notably the euro.
Over a two-week stretch, the EUR/USD moved roughly 7,800 pips, producing a series of large weekly candles, historically a sign that volatility is far from over.
Context matters. Despite recent softness, the dollar has strengthened significantly over the long term. From trading below euro parity in 2022 to highs near 1.60 in 2008, the broader trend has favored the dollar. So, recent weakness fits within a normal cycle of fluctuation.
Volatility spiked in response to tariffs and shifting trade policies. Markets have been whipsawed by tit-for-tat actions and policy reversals. With conflicting signals and fast-moving headlines, direction has become murky, creating an environment ripe for large swings.
The dollar has remained range-bound against many currencies tied to large U.S. trade deficits, such as the Mexican peso and Vietnamese dong. But against the euro, weakness has been more pronounced—possibly signaling the start of a longer-term downtrend.
Yield differentials remain a key driver of currency moves. A recent rise in 10-year German bund yields, for example, has widened spreads in favor of the euro, supporting its rally. These movements reflect more than interest rate policy, as they’re shaped by inflation, fiscal shifts, and trade dynamics.
While the U.S. has historically maintained a “strong dollar” stance, current priorities seem focused on economic stabilization. The dollar remains dominant, factoring into 88% of global FX transactions, but other safe havens have gained traction. Gold surged to near $ 3,000, while Bitcoin spiked before falling in tandem with other risk assets.
The U.S. debt-to-GDP ratio sits near 125%, with $ 36 trillion in debt versus $ 29 trillion in GDP. Reducing the deficit and reigniting growth are clear priorities. Structural change rarely comes without short-term pain, and a recession may be part of the process.
Traders are relying on both technical and fundamental tools. While charting remains essential, economic calendars are critical as inflation data, central bank decisions, and trade headlines drive daily sentiment. The ongoing trade disputes introduce a layer of uncertainty that doesn’t follow a schedule and can’t be easily modeled.
As global supply chains are reshaped, some companies may struggle while others become more resilient—much like businesses that adapted during the pandemic. Expect similar outcomes as firms reassess dependencies, improve efficiencies, and navigate shifting margins.
Financial markets are reflecting these transitions. Until tariff policies are finalized, expect continued volatility across exchange rates, yields, and commodities.
Interest rate policy remains flexible. With inflation easing but still elevated, the Federal Reserve could introduce emergency measures to soften a slowdown. But in today’s environment, rate cuts don’t guarantee dollar weakness, given the influence of inflation expectations, tariffs, and global repositioning.
The global economy is undergoing a realignment. For us, that means staying focused on the ITV indicator and continuing to apply the slow, steady growth strategy that has carried us through all kinds of market environments.

DoorDash, Inc. (DASH) is trading around $CONTENT.05 and should be closed early for a gain.
The Top Instant Income Opportunities This Week
Below you will find the top trade candidates identified by the Income Trader Volatility (ITV) indicator. Each of these trades recommends selling (to open) a put option. If you’re looking to make additional Instant Income trades, I can’t think of a better list of stocks to start your research.
Bonus trades have less stringent risk parameters, and these trades have slightly more risk than trades I recommend for the Income Trader portfolio. Risk is still relatively low in a bonus trade, but it is not low enough to pass my most rigorous screens. We recommend closing all bonus trades when they trade at $ 0.10 or below.

I always recommend the use of limit orders when entering an options trade. A limit at the midpoint between the bid and ask prices will often be filled fairly quickly.
The charts below show this week’s top candidates: In the upper section of each chart, you can see the stock’s weekly price movement; in the bottom section, you’ll see the stock’s ITV (red line) and the ITV’s 20-week moving average (blue line). These charts usually show several previous signals and could help subscribers evaluate how successful signals were in the past.

Good Trading,
April 9, 2025 - 7:00 am
The Shift in Investing Mindset
Over the last few years, how people think about investing has shifted, especially since the pandemic. Before 2020, investing discussions were often centered around companies and their products. You’d hear things like:
“I see a lot of customers in the local Target. Their stock must be doing well.”
“Apple just launched a new iPhone. Should I pick up Apple stock?”
Back then, the conversation focused on understanding the company and its product. People believed that strong products would drive sales, which, in turn, would drive the stock price up.
We all knew that wealth took time to build. It wasn’t about getting rich quickly; success was something you worked toward, slowly and steadily. But then, everything changed.
When the pandemic hit, the focus shifted away from companies to something far more fleeting: gains. What shocked me most was how quickly people became obsessed with making money fast—and how impatient they were to see those gains.
It wasn’t about the company or its fundamentals anymore. It was all about the price. People weren’t asking, “Is Target innovating?” or “How is Apple positioned for long-term growth?” They were asking, “What’s hot right now?”
They were chasing price movement, not value.
It didn’t take long for many of those chasing trends to get burned.
I haven’t heard from those people in a long time. Perhaps they gave up, or maybe they just stopped talking about it. But the lesson is clear: markets don’t reward short-term, trend-chasing behavior in the long run.
On the other hand, I still hear from those who took the steady, long-term route. Many of the older investors I know stuck with their dividend stocks, annuities, and options trading, and they’re still seeing the same steady returns they planned for decades ago.
Their strategy, build it slow, let it grow—worked. And it’s why they’re in a position of financial security.
Whether you’re buying bonds, dividend stocks, or trading options, the key to long-term success in the market is discipline. I’ve stuck to my put-selling strategy through some of the toughest market conditions since the Great Financial Crisis, and I’m confident it will continue to serve us well.
There’s one thing that will always be constant: volatility. The market will experience ups and downs, but what keeps traders like us going is the ability to stick to a strategy, manage risk, and adjust as conditions change.
We’re still here, still trading—not because we’re chasing the next hot trend, but because we know how to read the market, manage risk, and adjust our strategy when needed.
And that’s exactly why there are no trades today. We are reading the market and managing risk until our indicator says it’s time to trade.
Puts: Portfolio & Updates

DoorDash, Inc. (DASH) is trading above our strike price and on track to expire worthless later this month.
Good Trading,
April 2, 2025 - 7:00 am
Reading the Market’s Mood
Last weekend, I was doing some spring cleaning and came across a book from a friend and mentor. It was Mike Carr’s Conquering the Divide.
I hadn’t opened it in years, but revisiting it reminded me why his approach has always stuck with me. One quote early in the book brought me back: “The market is driven by emotion and if we can understand what drives emotion, we can better understand the market.”
That observation may sound simple, but in practice, it shapes how we approach risk, timing, and discipline. Carr’s research showed that bear markets tied to recessions tend to be deeper and more damaging, something we’ve seen repeatedly.
Yet the important insight wasn’t just about the severity of losses. It was how those losses tended to unfold.
After fear peaks and the economy begins to stabilize, the market improves quickly. In his words, “After investors begin fearing the worst, the economy shows signs of stabilizing and the market improves quickly.”
That turning point, the shift from panic to early recovery, is where many investors get tripped up. Confidence returns faster than the fundamentals, and that confidence, often makes the market most vulnerable at the time when investors feel most confident.
That dynamic isn’t limited to past market cycles. We’re seeing something similar now. Stock indexes are climbing, volatility is easing, and many investors are optimistic again, even as indicators like consumer sentiment and manufacturing data show signs of stress.
It’s not a call for panic. But it is a moment to pay attention.
Reading the book again reminded me why I built ITV. I didn’t want a tool that chased headlines. I wanted a way to measure the emotional undercurrent of the market, to help identify when fear had exhausted itself or when confidence was arriving too early.
Carr’s work emphasized the role of confidence in valuation, and how much of what drives investor behavior isn’t about earnings or forecasts, it’s about perception.
That’s the kind of clarity we aim for each week. Not prediction, not reaction—just disciplined observation of what the market is telling us, even when it isn’t loud about it.
So what is the market telling us right now? That discipline matters. That clarity comes from observation, not reaction. And that strategies rooted in consistency, like ours, are built for these kinds of moments.
Today’s Trade: Generate 1.7% In DASH
As I write this, DASH is trading around $ 182.25. This week, I recommend selling (to open) DASH Apr-17 $ 150 Puts for $ 0.50 – $ 0.75. That’s a put option on DASH with a strike price of $ 150 that expires on April 17, 2025 (DASH250417P00150000).

When entering the trade, I recommend using a limit order near or below the current ask price of the option. (A price quote will include a bid and ask price; trades are often completed between these two prices.)
For example, if the current quote on this option is “bid $ 0.60, ask $ 0.70,” I would suggest using a limit order to sell at $ 0.65. If that order is not filled within a few hours, you could lower the limit price based on the current quote. A limit order at this level will usually be filled quickly.
No matter what the current bid and ask prices are, I do not recommend trading outside the limit I set for the trade. For this trade, your limit price should be between $ 0.50 and $ 0.75.
As soon as your trade is executed, you will generate immediate income of about $ 50 (each contract controls 100 shares), assuming you enter the trade at the bottom of the range. (I’m using the bottom of the range because that’s the least amount of income we’ll accept for this trade, which gives us the most conservative estimate of our return.)
Selling this put will obligate you to buy DASH at $ 150 a share if the stock trades for less than that on April 17th (the last day these options can be traded).
Buying 100 shares of DASH at $ 150 each would cost $ 15,000. To initiate this trade, your broker will likely require you to deposit a percentage of that obligation in your account, like a down payment on a house.
This is called a “margin requirement.” It usually runs about 20% of the amount it would cost you to buy the shares. This DASH trade would require a margin deposit of $ 3,000 (20% of $ 15,000).
Here’s how the trade looks if the option expires worthless:

Assuming DASH trades for $ 150 or more on April 17th, we keep the premium and make a profit of $ 50 on $ 3,000, or 1.7%, in 16 days. If we can repeat a similar trade every 16 days, we will earn about 38.7% on our capital in 12 months.
Recommended Trade: Sell DASH Apr-17 $ 150 Puts for $ 0.50 – $ 0.75. Remember, each option contract you sell represents a potential obligation to purchase 100 shares of DASH. If you’re not comfortable owning more than 100 shares of DASH, don’t sell more than one put.
I don’t recommend using a stop-loss on this trade. I will be monitoring it closely and will send an immediate update if anything changes.
As always, I recommend readers use limit orders to execute trades. If prices move and you can’t get the premium you want, don’t chase the trade. Income Trader is a weekly publication, so you’ll get plenty of opportunities to Generate income selling puts and covered calls.
The Top Instant Income Opportunities This Week
Below you will find the top trade candidates identified by the Income Trader Volatility (ITV) indicator. Each of these trades recommends selling (to open) a put option. If you’re looking to make additional Instant Income trades, I can’t think of a better list of stocks to start your research.
Bonus trades have less stringent risk parameters, and these trades have slightly more risk than trades I recommend for the Income Trader portfolio. Risk is still relatively low in a bonus trade, but it is not low enough to pass my most rigorous screens. We recommend closing all bonus trades when they trade at $ 0.10 or below.

I always recommend the use of limit orders when entering an options trade. A limit at the midpoint between the bid and ask prices will often be filled fairly quickly.
The charts below show this week’s top candidates: In the upper section of each chart, you can see the stock’s weekly price movement; in the bottom section, you’ll see the stock’s ITV (red line) and the ITV’s 20-week moving average (blue line). These charts usually show several previous signals and could help subscribers evaluate how successful signals were in the past.

Good Trading,
March 26, 2025 - 7:00 am
Confidence Creeps Back Into the Market
Confidence is a tricky thing. It influences how people interpret current events and plan for the future. While technology and algorithms play a larger role in investing today, emotions like fear and greed still shape market behavior. We’ve seen both at work recently, as investor sentiment has slowly moved from caution to optimism.
As Jesse Livermore once said, “The human side of every person is the greatest enemy of the average investor or speculator.” That insight still rings true. Even with models driven by data, it’s human emotion like confidence, fear, and hope that still drives buying and selling decisions in today’s market.
After a sharp correction fueled by fear, signs of renewed optimism are starting to show. Monday’s rally reflected growing investor confidence, sparked in part by hopes of tariff relief.
But that alone doesn’t fully explain Tesla’s (TSLA) breakout. A solid rebound would’ve made sense considering how much the stock had dropped, but a 12% jump? That points to something beyond fundamentals: classic FOMO (Fear of Missing Out).
After holding back for weeks, investors jumped in quickly once the rally showed signs of strength.
While TSLA’s price declined in recent weeks, many investors continued buying the dip. That momentum faded last week, possibly due to shaken confidence or limited liquidity. But once the stock began to rally, buyers quickly returned—unwilling to miss the move they’d been anticipating.
Market movements are always shaped by a tug-of-war between fear and greed. And while FOMO includes “fear” in the name, it’s actually driven by greed. Fear is the worry of losing money; greed is the worry of not making enough.
FOMO doesn’t vanish, it just waits for a spark. That’s why bear market rallies are often fast and intense, showing that greed still has a pulse, even in tough markets.
The release of the Conference Board’s Consumer Confidence Index added another layer to the conversation. The March reading fell to 92.9, missing expectations of 94.0 and dropping below February’s upwardly revised 100.1 (initially reported as 98.9).
This marks the lowest level of consumer confidence since the early days of the COVID pandemic, although still well above the lows of the 2008 financial crisis.
Despite the drop in consumer confidence, markets didn’t react strongly, though bond yields edged lower. Traders may believe the decline stems largely from tariff uncertainty, an issue they expect will ease soon.
For now, confidence appears to be holding, but the coming weeks will be the true test.
The Top Instant Income Opportunities This Week
Below you will find the top trade candidates identified by the Income Trader Volatility (ITV) indicator. Each of these trades recommends selling (to open) a put option. If you’re looking to make additional Instant Income trades, I can’t think of a better list of stocks to start your research.
Bonus trades have less stringent risk parameters, and these trades have slightly more risk than trades I recommend for the Income Trader portfolio. Risk is still relatively low in a bonus trade, but it is not low enough to pass my most rigorous screens. We recommend closing all bonus trades when they trade at $ 0.10 or below.

I always recommend the use of limit orders when entering an options trade. A limit at the midpoint between the bid and ask prices will often be filled fairly quickly.
The charts below show this week’s top candidates: In the upper section of each chart, you can see the stock’s weekly price movement; in the bottom section, you’ll see the stock’s ITV (red line) and the ITV’s 20-week moving average (blue line). These charts usually show several previous signals and could help subscribers evaluate how successful signals were in the past.


Good Trading,
March 19, 2025 - 6:00 am
Open Interest: What It Reveals About the Options Market
I had a great question about open interest recently, and it made me realize that it’s one of those things others might wonder about too.
I know many of you have been with me for a long time, but sometimes we get comfortable and need to revisit the basics. Even experienced traders benefit from refreshing core concepts, so let’s take a closer look at open interest.
Open interest is a fundamental concept in options trading, yet it is often misunderstood by traders who mistake it for volume. While volume tracks the number of contracts traded in a single session, open interest measures the total number of contracts that remain open.
This distinction is important because open interest provides a clearer picture of market commitment and liquidity, offering insights that go beyond daily trading activity.
Unlike volume, open interest is not updated in real time. It is calculated by the Options Clearing Corporation (OCC) and is only adjusted overnight, once all trades have been settled. This means that traders looking to analyze open interest must wait until the next trading day for updated figures.
The process of how open interest changes is straightforward: if two traders enter a new options position, open interest increases. If one trader closes a position while another opens a new one, open interest remains the same. When both traders close out their positions, open interest declines.
One of the most valuable aspects of open interest is its role in assessing market liquidity. A high open interest suggests that many traders are holding positions in a particular option, which often results in tighter bid-ask spreads and better price efficiency.
On the other hand, options with little to no open interest may be illiquid, making it more challenging to enter or exit trades at desirable prices.
This liquidity aspect is particularly important for traders who engage in strategies that require efficient execution, such as spreads or large directional bets.
Beyond liquidity, open interest also serves as an indicator of market sentiment. When open interest rises significantly, it signals that new money is flowing into the options market, which may reinforce trends in the underlying asset.
If open interest remains flat despite high volume, it suggests that traders are merely rotating positions rather than committing new capital. A sudden decline in open interest, especially following a major event, can indicate that traders are unwinding their bets, signaling a potential shift in sentiment.
Open interest also plays a role in identifying key price levels within the options market. If a particular strike price has an unusually high level of open interest, it can act as an unofficial support or resistance level, as traders and market makers may have positions that require hedging around that strike.
This can lead to price clustering near those levels, particularly as expiration approaches. In some cases, a phenomenon known as “pin risk” occurs, where a stock price hovers around a heavily traded strike price near expiration, leading to last-minute volatility as traders adjust their positions.
Event-driven trading often sees open interest spikes, particularly around earnings reports, economic releases, or major corporate news.
Before such events, traders frequently establish positions, leading to an increase in open interest.
After the event, as the uncertainty fades and traders unwind their positions, open interest typically declines. This pattern can provide clues about how much risk traders were willing to take on ahead of key events and how quickly they are willing to exit once the uncertainty has passed.
While open interest itself is not a trading strategy, it provides critical information that traders can use to refine their approach.
Professional traders and market makers often use open interest data to anticipate potential price movements, assess liquidity, and identify market positioning.
It can also help traders understand when an option is likely to be exercised early, particularly for deep in-the-money American-style options where dividend capture or other strategic considerations come into play.
Traders looking to gain an edge in the options market must recognize that open interest is just one piece of the puzzle. It should be analyzed alongside other factors such as implied volatility, historical open interest trends, and overall market conditions.
Understanding open interest is not about predicting price direction with certainty, but rather about interpreting market dynamics in a way that enhances decision-making.

Capital One Financial Corporation (COF) was closed yesterday in a trade alert.
The Top Instant Income Opportunities This Week
Below you will find the top trade candidates identified by the Income Trader Volatility (ITV) indicator. Each of these trades recommends selling (to open) a put option. If you’re looking to make additional Instant Income trades, I can’t think of a better list of stocks to start your research.
Bonus trades have less stringent risk parameters, and these trades have slightly more risk than trades I recommend for the Income Trader portfolio. Risk is still relatively low in a bonus trade, but it is not low enough to pass my most rigorous screens. We recommend closing all bonus trades when they trade at $ 0.10 or below.

I always recommend the use of limit orders when entering an options trade. A limit at the midpoint between the bid and ask prices will often be filled fairly quickly.
The charts below show this week’s top candidates: In the upper section of each chart, you can see the stock’s weekly price movement; in the bottom section, you’ll see the stock’s ITV (red line) and the ITV’s 20-week moving average (blue line).


Good Trading,
March 18, 2025 - 11:44 am
Sell COF
I officially recommend closing the COF position. Stay tuned for new trading opportunities in tomorrow’s weekly issue.
Good Trading,
March 14, 2025 - 3:42 pm
Trade Update: COF
Capital One Financial Corporation (COF) continues to climb as the trading day nears its close, now trading around $ 171.20, further improving our exit opportunity.
The March 21 $ 180 puts, which were trading at $ 10.30 in my last update, have now dropped to $ 9.10. This is the best exit opportunity we’ve seen so far, and if you are considering closing, this may be your best shot.
I am officially keeping the trade open and watching for further improvement, but to be clear, I do not expect COF to reach $ 180 before expiration.
That said, I am in no way saying that holding is the best decision for you. If you want to close, you should do so.
My priority is ensuring you have the best options for managing risk. I’ll continue monitoring and will update as needed.

Good Trading,
March 12, 2025 - 3:19 pm
Trade Update: COF
As expected, COF has moved higher, currently up 5.2% to around $ 170.65. While it remains below our $ 180 strike, we are seeing the improved exit opportunity we anticipated. I am still officially holding, but I want to keep you informed. If you are considering closing, today presents a better opportunity, with the puts now trading around $ 10.30 compared to $ 16.00 yesterday.

Good Trading,
March 12, 2025 - 6:00 am
The Hidden Factors Driving Options Prices
I get a lot of questions about trading options. While we focus on put selling here, I know many of you trade beyond that. I wanted to share some insights on forward values and rho, key factors in options pricing.
Right now, many options traders are frustrated because trades aren’t performing as expected. A common example is traders buying VIX calls and noticing their options don’t move in line with spot VIX.
This misunderstanding stems from the fact that options are priced based on the forward value of the underlying security at expiration, rather than the spot value at the time of purchase. Forward value is a crucial concept in options pricing and plays a significant role in various market conditions.
When trading VIX options, the price is determined by the corresponding VIX futures contract that expires in the same month or week as the option. There can be moments when these futures trade close to the spot price, but they can also diverge significantly.
Last week, spot VIX was elevated, yet the VIX futures curve remained flat beyond the near term.
At that point, the at-the-money value for most VIX options was around 20.5, even though the widely quoted spot VIX stood at 23. This divergence may have led call buyers to believe they were getting a bargain, while put buyers might have felt prices were unusually high.
A similar concept applies when trading options on dividend-paying stocks. Since dividends reduce the forward value of a stock, those who hold options instead of shares on an ex-dividend date miss out on the dividend payment.
As a result, experienced traders often exercise deep in-the-money calls to avoid this loss.
While forward values remained relatively stable when interest rates were near zero, the recent rise in rates has made them more relevant. When rates increase, forward prices must account for the opportunity cost of holding cash versus investing in interest-bearing assets.
This is where rho, one of the lesser-known options greeks, comes into play. It measures the sensitivity of an option’s price to interest rate changes.
For a long time, rho was largely ignored because interest rates were low and stagnant.
However, with rates experiencing volatility and generally increasing, rho has become more relevant.
Options pricing models factor in forward values, meaning that even if the underlying stock does not move, options prices adjust based on interest rate expectations.
Higher interest rates typically push futures prices higher, a phenomenon known as contango.
When rates were near zero, forward prices were nearly identical to spot prices, but with rates at 3%, the forward value of a $ 50 stock over three months increases slightly to reflect the cost of capital.
The effect of rate changes is more pronounced for higher-priced stocks and longer-dated options.
Previously, rho was primarily relevant for stocks that were hard to borrow, as negative borrowing rates could depress forward values. However, with the prevailing Fed Funds rate now playing a greater role, rho is a crucial factor to consider.
For index options like those on the S&P 500, futures typically trade at a premium because interest rates exceed the dividend yield. This creates a consistent contango structure in which futures prices rise over time.
However, VIX futures follow a different pattern. Unlike the S&P 500, VIX futures do not follow a stable pattern.
In times of market stress, the VIX futures curve can flatten or even slip into backwardation, where near-term contracts trade higher than longer-dated ones.
This occurs when demand for volatility protection surges in the short term but is expected to normalize later. As a result, call option returns can vary significantly based on which expirations are used.
Although rho remains less significant than other options greeks such as delta, gamma, theta, and vega, it shouldn’t be ignored.
Traders focused on high-priced indexes or longer-dated options must account for interest rate effects when analyzing forward values.
Incorporating rho into options analysis offers deeper insight into pricing dynamics, equipping traders to make more informed decisions.
Understanding forward values, interest rates, and the structure of VIX futures is key to grasping the mechanics of options pricing and steering clear of common mistakes.
Puts: Portfolio & Updates

Capital One Financial Corporation (COF) dropped after news of a Trump Organization lawsuit, adding short-term pressure. While I don’t expect it to recover above our strike, I see potential for a move higher, offering a better exit. A recent analyst upgrade could provide some support as the market reassesses the stocks longer-term prospects. Remember, if you’d prefer to close and avoid further exposure, please do so
The Top Instant Income Opportunities This Week
Below you will find the top trade candidates identified by the Income Trader Volatility (ITV) indicator. Each of these trades recommends selling (to open) a put option. If you’re looking to make additional Instant Income trades, I can’t think of a better list of stocks to start your research.
Bonus trades have less stringent risk parameters, and these trades have slightly more risk than trades I recommend for the Income Trader portfolio. Risk is still relatively low in a bonus trade, but it is not low enough to pass my most rigorous screens. We recommend closing all bonus trades when they trade at $ 0.10 or below.

I always recommend the use of limit orders when entering an options trade. A limit at the midpoint between the bid and ask prices will often be filled fairly quickly.
The charts below show this week’s top candidates: In the upper section of each chart, you can see the stock’s weekly price movement; in the bottom section, you’ll see the stock’s ITV (red line) and the ITV’s 20-week moving average (blue line). These charts usually show several previous signals and could help subscribers evaluate how successful signals were in the past.

Good Trading,
March 10, 2025 - 1:13 pm
Trade Update: COF
Our COF trade is reacting negatively to the recent lawsuit news. While I don’t expect a full recovery before expiration, I do think the stock could rebound slightly once the initial reaction settles. If you prefer to close now to limit additional exposure, please do so. Only you know what aligns with your portfolio and what’s best for you.
Our strategy is designed to perform in all market environments, but the challenge with unexpected news is that we can’t plan for it. I will continue closely monitoring this trade and communicating with you. I understand that losses hurt and this market environment is exceptionally painful right now. We will get through it and continue finding profitable trades.
Good Trading,

March 6, 2025 - 11:15 am
Trade Update: COF
For those of you in the COF trade, I just wanted to check in. I see the headlines, the doom and gloom, and all the noise this week. Market volatility, tariffs, slowing growth… it’s a lot to digest. But let’s take a step back.
COF is still trading above our $ 180 strike price, and with the CFPB dropping its enforcement action, that’s one less thing for investors to worry about.
I’m keeping a close eye on this trade, and for now, we’re holding steady. I’ll update if anything changes.
Puts: Portfolio & Updates

Good Trading,
March 4, 2025 - 11:05 pm
Hetty Green: The Forgotten Financial Pioneer of Wall Street
You might remember me talking about Hetty Green before.
As Women’s History Month comes around again, I want to revisit her story because it’s one that deserves to be remembered.
If you haven’t heard of her, Henrietta Howland “Hetty” Green was one of the greatest traders of the early twentieth century. When she passed away in 1916, her net worth was estimated to be between 0 million and 0 million, equivalent to .25 billion to .5 billion today.
That made her, quite possibly, the richest woman in the world at the time. And she earned every penny through investing.
In 1998, American Heritage magazine published a list of the wealthiest Americans in history. Hetty Green was ranked number 36, and the only woman on the list.
That fact alone is remarkable. Unlike many of her wealthy contemporaries, she didn’t inherit a vast fortune, and she wasn’t married to a powerful industrialist.
She made her own fortune through skill, discipline, and an unshakable focus on value. As one of her biographers pointed out, her only financial liability was her husband.
While Wall Street was dominated by men leveraging connections and brute force, Hetty relied on her intellect.
She traded stocks, bonds, and real estate, always searching for underpriced assets. Her investment philosophy, buying undervalued assets and waiting for them to rise, predated the principles later championed by Benjamin Graham and Warren Buffett. She mastered value investing before it had a name.
Yet, despite her incredible success, Hetty Green’s legacy is not widely celebrated. One reason is that she took no steps to ensure her name lived on. When she died, she passed her fortune to her children, and when her daughter passed in 1951, much of the wealth was distributed among various charities, hospitals, and schools.
While many billionaires create foundations in their own name, Hetty simply let her fortune go where it was needed.
Another reason she remains a lesser-known figure in financial history is the way she was portrayed in her lifetime. Instead of being recognized as a brilliant investor, she became infamous for her eccentricities.
She was labeled the “Witch of Wall Street,” and the stories that stuck were about her extreme frugality, how she allegedly refused medical care for her son’s leg injury, leading to its amputation, or how she wore the same black dress every day and moved from apartment to apartment in New Jersey to avoid taxes.
These tales, whether exaggerated or not, overshadowed her financial genius.
But what stands out most to me is not the legend, it’s her mind.
Hetty navigated an era dominated by robber barons, when fortunes were often built through exploitation, political maneuvering, or outright corruption.
Yet, she was never accused of wrongdoing. She succeeded not by cutting corners or leveraging power, but by buying low, selling high, and keeping her emotions out of her trades.
She was ahead of her time.
Like Warren Buffett, Hetty had a gift for distilling complex financial ideas into simple, timeless principles. As she put it:
“There is no great secret in fortune-making … All you do is buy cheap and sell dear, act with thrift and shrewdness, and be persistent.”
And like Buffett, she was always prepared when markets crashed. In 2008, Buffett made billions by stepping in to support Goldman Sachs and General Electric. A century earlier, during the Panic of 1907, Hetty lent .1 million (about million today) to keep New York City afloat.
As she later said:
“When the crash came, I had the money, and I was one of the very few who really had it. The others had their securities and their values. I had the cash, and they had to come to me in droves.”
Yet, unlike Buffett, she wasn’t interested in holding onto investments forever. She understood that every asset had its price.
“I never buy anything just to hold it. There is a price on everything I have. When that price is offered, I sell.”
That mindset resonates with me. Like Hetty, I focus on the short term, taking opportunities to compound gains rather than betting everything on a single outcome.
The best advice I can give? Learn from Hetty Green. Keep emotions out of your trades. Stay disciplined. Stay focused on consistent, profitable trades. Over time, that’s how real wealth is built.
Puts: Portfolio & Updates

Capital One Financial Corporation (COF) closed at $ 184.90, down 5.7% from the previous close, reflecting broader market weakness. The stock is still trading above our $ 180 strike price with two weeks until expiration. Additionally, the Consumer Financial Protection Bureau (CFPB) has dismissed its enforcement action against Capital One, eliminating a key regulatory concern. This could provide some stability to investor sentiment in the near term. I am keeping a close watch on this trade and will send an update if necessary.
The Top Instant Income Opportunities This Week
Below you will find the top trade candidates identified by the Income Trader Volatility (ITV) indicator. Each of these trades recommends selling (to open) a put option. If you’re looking to make additional Instant Income trades, I can’t think of a better list of stocks to start your research.
Bonus trades have less stringent risk parameters, and these trades have slightly more risk than trades I recommend for the Income Trader portfolio. Risk is still relatively low in a bonus trade, but it is not low enough to pass my most rigorous screens. We recommend closing all bonus trades when they trade at $ 0.10 or below.

I always recommend the use of limit orders when entering an options trade. A limit at the midpoint between the bid and ask prices will often be filled fairly quickly.
The charts below show this week’s top candidates: In the upper section of each chart, you can see the stock’s weekly price movement; in the bottom section, you’ll see the stock’s ITV (red line) and the ITV’s 20-week moving average (blue line).


Good Trading,
February 26, 2025 - 6:00 am
The Market’s Big Test: A Shift in Sentiment
The market just faced a major test, and the outcome wasn’t reassuring. For years, buying the dip has been a go-to strategy—stocks sell off, traders step in, and the rebound follows. But last week, that pattern broke.
The early bounce on Monday stalled, and by the end of the session, it was clear that something had changed.
Friday’s selloff wasn’t a random move. It was the market catching up to the reality that’s been unfolding for months.
Consumer confidence has been sliding, but now, there’s hard data backing up the shift. Retail sales missed expectations, and a major retailer confirmed the slowdown, saying shoppers weren’t spending as aggressively.
With consumer spending making up two-thirds of the economy, this shift is significant. If consumers pull back, businesses feel it, earnings take a hit, and the market reacts.
At the same time, inflation expectations are creeping higher again, and layoffs, once concentrated in tech and media, are spreading across more industries. The widening gap between institutional and retail investors is another red flag.
The buy-the-dip mentality has been ingrained in market behavior, but not every dip is an opportunity. That strategy works in a strongly trending market, where prices recover quickly. It doesn’t hold up as well when there’s a fundamental shift in valuations.
That’s exactly what’s happening now. Smart money isn’t rushing in, and some of the most well-known investors in the world have expressed concerns. The fact that this selling isn’t being met with aggressive buying suggests something deeper is at play.
Beyond consumer weakness, broader economic concerns are weighing on sentiment. After years of strong government spending, there’s now a push for spending cuts.
The market has been conditioned to expect deficit-driven growth, and any meaningful shift in fiscal policy could create headwinds. The risk isn’t just in Washington. If spending cuts hit federal jobs across the country, local economies will feel the effects, which could accelerate the slowdown.
Meanwhile, new trade tariffs are set to take effect over the next two months, targeting key industries like steel, autos, and semiconductors. If these aren’t resolved, economic growth could fall below 1.5%, creating a dangerous combination of weaker consumer spending and declining government support.
The global trade environment remains volatile, and any misstep could add pressure to an already fragile outlook.
One of the clearest signals of market unease is coming from bonds. The yield curve is flattening, with the spread between the 10-year and 2-year Treasury yields shrinking from 40 basis points to 20. This kind of move typically signals recession fears, as investors rush to lock in long-term yields before the economy slows.
Within equities, defensive positioning is becoming more pronounced. Consumer staples were the only sector that posted gains on Friday, reinforcing the idea that investors are seeking stability rather than chasing growth.
Utilities, which historically serve as a safe haven, haven’t responded as expected, likely due to their recent connection to the AI-driven trade. The rotation into defensive names is happening, but not in a uniform way.
With institutional money stepping back and volatility rising, market conditions are shifting. This is an environment where precision matters. Rising fear is driving up put premiums, creating better opportunities, but only for traders using a system designed to filter out unnecessary risk.
This isn’t a market where blindly selling puts works. That’s why ITV is so valuable right now. While many traders struggle to adapt, ITV continues to cut through the noise, identifying the best trades while avoiding those that don’t meet our strict criteria.
The market is in transition. The easy, liquidity-driven rallies of the past are giving way to uncertainty, institutional caution, and shifting consumer behavior.
But for those following ITV, these shifts aren’t roadblocks, they’re opportunities. The key isn’t just knowing when to act, it’s having the right signals at the right time. That’s exactly what ITV delivers.

Capital One Financial Corporation (COF) is trading lower amid broader market weakness and ongoing regulatory concerns. Despite the decline, the position remains on track to expire worthless next month.
The Top Instant Income Opportunities This Week
Below you will find the top trade candidates identified by the Income Trader Volatility (ITV) indicator. Each of these trades recommends selling (to open) a put option. If you’re looking to make additional Instant Income trades, I can’t think of a better list of stocks to start your research.
Bonus trades have less stringent risk parameters, and these trades have slightly more risk than trades I recommend for the Income Trader portfolio. Risk is still relatively low in a bonus trade, but it is not low enough to pass my most rigorous screens. We recommend closing all bonus trades when they trade at $ 0.10 or below.

I always recommend the use of limit orders when entering an options trade. A limit at the midpoint between the bid and ask prices will often be filled fairly quickly.
The charts below show this week’s top candidates: In the upper section of each chart, you can see the stock’s weekly price movement; in the bottom section, you’ll see the stock’s ITV (red line) and the ITV’s 20-week moving average (blue line).


Good Trading,
February 19, 2025 - 6:00 am
Retail Sales Slide Raises Odds of Fed Rate Cut
The latest retail sales report has thrown a curveball at market expectations, with consumer spending slowing more than anticipated.
Retail sales fell 0.9% in January, the biggest monthly decline in nearly two years. Excluding gas and autos, the drop was a more modest 0.5%, but the control group, which feeds directly into GDP calculations, slipped 0.8%.
This signals that the consumer, who has been remarkably resilient over the past two years, may finally be pulling back. Given how much household spending has supported corporate earnings, this is a trend worth watching.
The weak retail data has also rekindled expectations for a potential Federal Reserve rate cut this summer.
Just days ago, a stronger-than-expected inflation report seemed to dash hopes of near-term easing. But with spending showing signs of strain, traders are once again pricing in the possibility that the Fed will step in to support growth.
Treasury yields responded immediately, with the 10-year yield falling to 4.45% as investors sought safety in bonds.
Stocks, meanwhile, held near all-time highs, reflecting a market that remains optimistic, but one that is carefully considering whether slowing consumption could weigh on earnings growth.
Adding to the mix, industrial production data showed a 0.5% increase in January, largely driven by a sharp rise in utility output due to colder weather. While this helped offset declines in mining and manufacturing, it doesn’t necessarily point to underlying economic strength.
Inflation also remains in focus, with import and export prices rising last month. Import costs increased 0.3%, while export prices climbed 1.3%, suggesting that price pressures are not fading as quickly as the Fed might like.
Looking beyond the U.S., global economic signals are mixed.
Singapore’s economy grew 5% year-over-year in the fourth quarter, though quarter-over-quarter growth slowed. In Europe, employment growth remains anemic, and the auto sector is struggling as demand for electric vehicles falls.
Porsche just announced 1,900 job cuts in Germany, citing weak EV sales and broader economic uncertainty. South Korea saw job growth bounce back in January after a December decline, though construction and retail remain weak.
Meanwhile, Canada’s economic data was lackluster, with manufacturing growth slowing and wholesale sales falling.
The big question now is whether inflation will continue to hold steady while consumer demand weakens.
Over the past two years, the stock market has thrived despite elevated inflation, as long as household spending remained strong. If spending slows while inflation remains sticky, the market could face new challenges.
For now, traders will be watching whether the Fed acknowledges this shift and how corporate earnings respond to signs of a more cautious consumer.
What does all of this mean for us? Lower Treasury yields suggest that investors are preparing for a slowdown, but the Fed’s response remains uncertain.
If economic data continues to soften, rate cuts could provide a tailwind for stocks.
However, if inflation remains persistent and the Fed stays on hold, equities could face renewed volatility.
As always, adapting to shifting market conditions is key, and fortunately, we can handle that.
Today’s Trade: Generate 1.9% in COF
Currently, COF is trading around $ 202.80. This week, I recommend selling (to open) COF March- 21 $ 180 Puts for $ 0.70 – $ 0.90. That’s a put option on COF with a strike price of $ 180 that expires on March 21, 2025 (COF250321P00180000).

When entering the trade, I recommend using a limit order near or below the current ask price of the option. (A price quote will include a bid and ask price; trades are often completed between these two prices.)
For example, if the current quote on this option is “bid $ 0.60, ask $ 0.70,” I would suggest using a limit order to sell at $ 0.65. If that order is not filled within a few hours, you could lower the limit price based on the current quote. A limit order at this level will usually be filled quickly.
No matter what the current bid and ask prices are, I do not recommend trading outside the limit I set for the trade. For this trade, your limit price should be between $ 0.70 and $ 0.90.
As soon as your trade is executed, you will generate immediate income of about $ 70 (each contract controls 100 shares), assuming you enter the trade at the bottom of the range. (I’m using the bottom of the range because that’s the least amount of income we’ll accept for this trade, which gives us the most conservative estimate of our return.)
Selling this put will obligate you to buy COF at $ 180 a share if the stock trades for less than that on March 21st (the last day these options can be traded).
Buying 100 shares of COF at $ 180 each would cost $ 18,000. To initiate this trade, your broker will likely require you to deposit a percentage of that obligation in your account, like a down payment on a house.
This is called a “margin requirement.” It usually runs about 20% of the amount it would cost you to buy the shares. This COF trade would require a margin deposit of $ 3,600 (20% of $ 18,000).
Here’s how the trade looks if the option expires worthless:

Assuming COF trades for $ 180 or more on March 21st, we keep the premium and make a profit of $ 70 on $ 3,600, or 1.9%, in 30 days. If we can repeat a similar trade every 30 days, we will earn about 23.1% on our capital in 12 months.
Recommended Trade: Sell COF Mar-21 $ 180 Puts for $ 0.70 – $ 0.90. Remember, each option contract you sell represents a potential obligation to purchase 100 shares of COF. If you’re not comfortable owning more than 100 shares of COF, don’t sell more than one put.
I don’t recommend using a stop-loss on this trade. I will be monitoring it closely and will send an immediate update if anything changes.
As always, I recommend readers use limit orders to execute trades. If prices move and you can’t get the premium you want, don’t chase the trade. Income Trader is a weekly publication, so you’ll get plenty of opportunities to Generate income selling puts and covered calls.
Puts: Portfolio & Updates
PVH Corp. (PVH) was closed prior to expiration for a loss.
The Top Instant Income Opportunities This Week
Below you will find the top trade candidates identified by the Income Trader Volatility (ITV) indicator. Each of these trades recommends selling (to open) a put option. If you’re looking to make additional Instant Income trades, I can’t think of a better list of stocks to start your research.
Bonus trades have less stringent risk parameters, and these trades have slightly more risk than trades I recommend for the Income Trader portfolio. Risk is still relatively low in a bonus trade, but it is not low enough to pass my most rigorous screens. We recommend closing all bonus trades when they trade at $ 0.10 or below.

I always recommend the use of limit orders when entering an options trade. A limit at the midpoint between the bid and ask prices will often be filled fairly quickly.
The charts below show this week’s top candidates: In the upper section of each chart, you can see the stock’s weekly price movement; in the bottom section, you’ll see the stock’s ITV (red line) and the ITV’s 20-week moving average (blue line). These charts usually show several previous signals and could help subscribers evaluate how successful signals were in the past.


Good Trading,
February 12, 2025 - 7:00 am
Navigating Market Uncertainty with ITV Precision
Investors are taking some profits amid rising global trade tensions, with the EU threatening tariffs in response to potential U.S. levies.
However, the pullback remains mild, as markets are supported by solid fundamentals, rising corporate earnings, steady consumer spending, a resilient labor market, and controlled inflation.
Reinforcing this stability, Fed Chair Jerome Powell told the Senate that the central bank sees no urgency to cut rates, emphasizing that current policy is well-positioned to address risks.
Concerns remain over inflation, particularly if trade disputes escalate or labor shortages push wages higher.
However, these pressures could be tempered by a slowdown in housing costs, which make up over 40% of the Consumer Price Index (CPI). If shelter inflation continues to ease, it could offset rising costs elsewhere and help sustain economic momentum.
The NFIB Small Business Optimism Index dipped from 105.1 to 102.8, falling short of expectations but still well above its long-term average of 98. Business owners cited hiring difficulties and cost pressures as major concerns, with taxes ranking third.
Additionally, optimism about future economic conditions declined, with the percentage of owners expecting improvement dropping by five points to 47%.
Meanwhile, sentiment among larger companies remains strong. The Bank of America Corporate Sentiment Score, which tracks executive commentary, hit its highest level since its inception in 2004.
Equities are tilting slightly bearish, with all major indices in the red. The Russell 2000, Dow, S&P 500, and Nasdaq 100 are down 0.6%, 0.2%, 0.1%, and 0.1%, respectively.
Sector performance is mixed, utilities, financials, and consumer discretionary stocks are lagging, while materials, energy, and technology are holding gains.
The bond market is also seeing minor selling, with 2-year and 10-year Treasury yields rising to 4.30% and 4.55%. The dollar is weakening slightly against most major currencies, though it remains firm against the franc, yuan, and yen.
Commodities are mostly lower, with copper, lumber, silver, and gold declining, while crude oil is up 1.4%, supported by concerns over potential sanctions on Iran and Russia.
Shelter costs have been a key driver of services inflation throughout the post-2022 disinflation period.
While much of the focus on labor shortages revolves around wage pressures, easing housing costs could provide relief. With shelter inflation slowing in recent months, this trend could help balance price pressures elsewhere, keeping inflation in check and supporting steady growth.
With markets largely steady despite trade concerns, we have opportunities to generate income while taking advantage of short-term uncertainty.
Economic fundamentals remain strong, limiting downside risk, while sector rotation offers pockets of strength.
By focusing on our ITV indicator, we can navigate this environment with confidence and continue finding new trading opportunities.

PVH Corp. (PVH) This is a tough one, but it’s time to take action. While the stock may still rebound before expiration, we need to focus on risk management. My official recommendation is to close the position now to prevent further downside.
If you prefer to hold and wait for a potential bounce, that is an option, but understand that it comes with continued risk. A move toward $ 85+ would reduce the put’s value, allowing for a better exit. However, at this point, the best move for most traders is to cut losses and move on.
Losses are never easy, but they are part of the process. This is our first loss in a long time, and while it stings, it does not define our strategy.
We will trade regularly to generate steady income, and over time, we’ll make up for setbacks. The key is discipline, sticking to our approach and managing risk along the way.
The Top Instant Income Opportunities This Week
Below you will find the top trade candidates identified by the Income Trader Volatility (ITV) indicator. Each of these trades recommends selling (to open) a put option. If you’re looking to make additional Instant Income trades, I can’t think of a better list of stocks to start your research.
Bonus trades have less stringent risk parameters, and these trades have slightly more risk than trades I recommend for the Income Trader portfolio. Risk is still relatively low in a bonus trade, but it is not low enough to pass my most rigorous screens. We recommend closing all bonus trades when they trade at $ 0.10 or below.

I always recommend the use of limit orders when entering an options trade. A limit at the midpoint between the bid and ask prices will often be filled fairly quickly.
The charts below show this week’s top candidates: In the upper section of each chart, you can see the stock’s weekly price movement; in the bottom section, you’ll see the stock’s ITV (red line) and the ITV’s 20-week moving average (blue line). These charts usually show several previous signals and could help subscribers evaluate how successful signals were in the past.


Good Trading,
February 5, 2025 - 5:00 am
Staying the Course in a Challenging Market
The market always finds a way to test traders. Some weeks, everything moves smoothly, trades play out as expected, and the strategy works like a well-oiled machine. Other weeks, we run into turbulence. This past week was one of those times.
Our PVH put trade came under pressure after J.P. Morgan issued a downgrade, citing slower-than-expected growth and macroeconomic challenges. That sent the stock lower and caused the value of our put options to rise.
Right now, we’re watching this position closely, and while it isn’t where we want it to be, it’s too early to say the trade is doomed. There’s still time for PVH to stabilize or rebound before expiration.
Situations like this remind us that losses are always a possibility in trading, but they don’t define our success. No strategy wins 100% of the time. What matters is how we manage risk, how we adjust to market conditions, and how we continue forward with discipline.
The current market environment presents its own set of challenges. Volatility has increased, with some stocks under pressure due to economic uncertainty and analyst downgrades.
Earnings season is in full swing, and while many companies are reporting better-than-expected results, their guidance remains shaky. Investors are hesitant, weighing the risks of higher interest rates, inflation pressures, and shifting consumer demand.
The Federal Reserve has made it clear that rates will remain elevated longer than initially expected, which is keeping a lid on certain sectors. Meanwhile, we’re seeing rotation—money flowing out of some industries and into others, often with little warning.
One of the key lessons of trading is that market conditions are always changing. Strategies that work well in certain environments can become trickier to navigate when sentiment shifts. That’s why adaptability is critical.
Over time, we refine our approach, adjusting for new trends while staying disciplined in execution. We don’t abandon what works because of a setback, we analyze, adjust, and keep going.
In moments like these, it is natural to second-guess. Should we have been more cautious? Should we have avoided this trade?
Hindsight is always clearer. The reality is that we made the trade based on sound logic at the time, selling puts at a price that offered a reasonable margin of safety, assuming market conditions remained stable.
But conditions changed. PVH was hit with a downgrade that accelerated selling, shifting the risk dynamic.
That doesn’t mean we are locked into a loss. There is still time on this trade, and PVH could stabilize or rebound, making our exit more manageable. Our strategy works because it is rooted in risk management, not blind optimism. We do not simply hope a trade will recover.
Instead, we assess the situation rationally, weigh our options, and make the best decision based on what’s in front of us. This means sometimes rolling positions to adjust risk, sometimes closing for a manageable loss, and sometimes waiting for a better exit opportunity.
Patience is key. While some traders panic and rush to exit, we take a measured approach. The option still has time until expiration, which means the market has time to stabilize.
Stocks often overreact to analyst downgrades before finding support. If PVH recovers slightly, we may have a better opportunity to exit or roll for a more favorable position.
This moment also reminds us of the importance of caution in uncertain environments. Moving forward, we will be even more selective in trade entry, ensuring we have an added margin of safety.
That does not mean we stop trading, it means we trade smarter, with sharper risk management.
The reality of trading is that losses happen, but we haven’t lost this trade yet. We are watching, analyzing, and preparing to adjust if needed. Even the best traders in the world take losses, but the difference between those who succeed and those who struggle is in how they handle adversity.
The ones who panic, abandon their strategy, or let emotions dictate decisions often end up in worse shape. The ones who stay level-headed, adjust where needed, and remain committed to their process come out stronger.
This isn’t the first time we’ve faced a tough market, and it won’t be the last. But we are still in control.
The strategy works. We will keep refining it, keep trading, and keep winning over the long run.

PVH Corp. (PVH) Our Feb-21 $ 90 puts are trading around $ 8.20, with the stock around $ 82.50 as I write this, after a J.P. Morgan downgrade citing slower growth and macroeconomic risks. As I mentioned in the alert yesterday, we do not want to be assigned shares, so if you prefer to close now, and take the loss, you can.
However, my recommendation is to wait until closer to expiration to see if PVH stabilizes or rebounds. While deep in-the-money puts don’t benefit much from time decay, a move toward $ 85+ would reduce the put’s value, allowing for a better exit or roll opportunity.
I will be watching this trade very closely and send another alert if immediate action is required. For now, we’re watching and waiting.
The Top Instant Income Opportunities This Week
Below you will find the top trade candidates identified by the Income Trader Volatility (ITV) indicator. Each of these trades recommends selling (to open) a put option. If you’re looking to make additional Instant Income trades, I can’t think of a better list of stocks to start your research.
Bonus trades have less stringent risk parameters, and these trades have slightly more risk than trades I recommend for the Income Trader portfolio. Risk is still relatively low in a bonus trade, but it is not low enough to pass my most rigorous screens. We recommend closing all bonus trades when they trade at $ 0.10 or below.

I always recommend the use of limit orders when entering an options trade. A limit at the midpoint between the bid and ask prices will often be filled fairly quickly.
The charts below show this week’s top candidates: In the upper section of each chart, you can see the stock’s weekly price movement; in the bottom section, you’ll see the stock’s ITV (red line) and the ITV’s 20-week moving average (blue line). These charts usually show several previous signals and could help subscribers evaluate how successful signals were in the past.


Good Trading,
February 4, 2025 - 3:08 pm
PVH Put Update – Watching for a Rebound

PVH Corp. (PVH) Our Feb-21 $ 90 puts are trading around $ 8.50, with the stock around $ 82 after a J.P. Morgan downgrade citing slower growth and macroeconomic risks. We do not want to be assigned shares, so if you prefer to close now, and take the loss, you can.
However, my recommendation is to wait until closer to expiration to see if PVH stabilizes or rebounds. While deep in-the-money puts don’t benefit much from time decay, a move toward $ 85+ would reduce the put’s value, allowing for a better exit or roll opportunity.
I will be watching this trade very closely and send another alert if immediate action is required. For now, we’re watching and waiting.
Good Trading,
January 29, 2025 - 12:27 pm
U.S. Home Sales Hit 30-Year Low: What It Means for Investors
U.S. home sales have plunged to their lowest level since 1995, as high mortgage rates and record prices squeeze buyers and stall the market. For two consecutive years, rising borrowing costs have created headwinds for buyers, sellers, and industries tied to real estate.
The sharp rise in mortgage rates has been the primary driver of the slowdown. Since late 2022, 30-year fixed mortgage rates have hovered between 6% and 8%, significantly increasing monthly payments and pricing out many would-be buyers.
Rising property taxes and insurance premiums have added to the financial strain. Many homeowners with low-interest mortgages are reluctant to sell, further tightening supply and keeping prices elevated.
Amid this challenging environment, there are signs of life. In December 2024, existing-home sales rose 6% from the previous month, marking the third consecutive monthly gain, a trend not seen since 2021.
While this suggests buyers and sellers are adapting to higher rates, sales remain 20% below 2019 levels and about a third lower than the six million homes sold annually during the 2021 housing boom. The spring selling season will be a critical test for the market’s recovery.
With inventory constrained, homebuilders have stepped in, offering incentives like subsidized mortgage rates to attract buyers. While this has helped, high borrowing costs continue to cap growth in the sector.
The slowdown’s ripple effects have been felt across the economy. Real estate companies like Zillow, Redfin, and D.R. Horton have faced increased volatility, while home improvement retailers like Home Depot, Lowe’s, and Wayfair have seen demand weaken as fewer people move or renovate.
For traders, housing data is more than just an economic indicator, it’s a trading signal. The housing slowdown illustrates how high interest rates affect consumer behavior and corporate performance.
Stocks tied to real estate, construction, and consumer spending remain key sectors to watch, and housing often serves as a bellwether for the broader economy.
As mortgage rates and economic conditions shift, housing will remain a critical battleground for traders, and our ITV indicator will be watching every move.

PVH Corp. (PVH) is still close to the strike price, but as we discussed last week, there’s still a full month before expiration. I will continue watching this trade closely and send an alert if necessary.
The Top Instant Income Opportunities This Week
Below you will find the top trade candidates identified by the Income Trader Volatility (ITV) indicator. Each of these trades recommends selling (to open) a put option. If you’re looking to make additional Instant Income trades, I can’t think of a better list of stocks to start your research.
Bonus trades have less stringent risk parameters, and these trades have slightly more risk than trades I recommend for the Income Trader portfolio. Risk is still relatively low in a bonus trade, but it is not low enough to pass my most rigorous screens. We recommend closing all bonus trades when they trade at $ 0.10 or below.

I always recommend the use of limit orders when entering an options trade. A limit at the midpoint between the bid and ask prices will often be filled fairly quickly.
The charts below show this week’s top candidates: In the upper section of each chart, you can see the stock’s weekly price movement; in the bottom section, you’ll see the stock’s ITV (red line) and the ITV’s 20-week moving average (blue line). These charts usually show several previous signals and could help subscribers evaluate how successful signals were in the past.


Good Trading,
January 21, 2025 - 11:08 pm
2025’s Financial Shifts: A Strategy That Endures
As we enter 2025, significant policy changes are taking shape, impacting retirement savings, healthcare costs, Social Security, and credit reporting. These changes, tied to the SECURE 2.0 Act, Inflation Reduction Act, and other regulations, aim to enhance financial security for millions of Americans.
While the details may seem complex, one thing remains clear: having a strategy built to withstand uncertainty is more important than ever.
People aged 60 to 63 can now take advantage of “super catch-up” contributions, increasing their 401(k) savings limit to ,750—a significant boost over previous limits. Other small increases, including those for Roth IRAs and health savings accounts, provide additional opportunities for retirement savers.
Out-of-pocket costs for Medicare Part D beneficiaries are capped at ,000 this year, offering meaningful relief for those with high medication costs. This change benefits millions and provides peace of mind for those managing chronic health conditions.
The income limit before Social Security benefits are reduced has risen to ,400 for early retirees and ,160 for those nearing full retirement age, allowing retirees to continue working with fewer penalties. Stricter withdrawal requirements apply to inherited IRAs, requiring non-spouse heirs to empty the account within 10 years. Missteps can result in significant penalties, making careful planning crucial.
New regulations also remove medical debt from credit reports, potentially raising credit scores for millions and improving access to loans and mortgages. However, this could lead to tighter upfront payment expectations from healthcare providers.
While these changes will undoubtedly influence individual financial decisions and broader market trends, the importance of a reliable strategy cannot be overstated.
The market will continue to shift, but as we’ve seen over the years, our Income Trader Volatility (ITV) strategy is built to endure and adapt through any conditions.
As 2025 unfolds, these changes serve as a reminder that markets and regulations will always evolve. With a time-tested, disciplined approach like we have, you can thrive no matter what lies ahead.
Puts: Portfolio & Updates

PVH Corp. (PVH) although PVH is currently closer to the strike price than we would prefer, there’s still a full month before expiration. I believe the puts will expire worthless. However, I’m monitoring the trade closely and will send an alert if necessary.
The Top Instant Income Opportunities This Week
Below you will find the top trade candidates identified by the Income Trader Volatility (ITV) indicator. Each of these trades recommends selling (to open) a put option. If you’re looking to make additional Instant Income trades, I can’t think of a better list of stocks to start your research.
Bonus trades have less stringent risk parameters, and these trades have slightly more risk than trades I recommend for the Income Trader portfolio. Risk is still relatively low in a bonus trade, but it is not low enough to pass my most rigorous screens. We recommend closing all bonus trades when they trade at $ 0.10 or below.

I always recommend the use of limit orders when entering an options trade. A limit at the midpoint between the bid and ask prices will often be filled fairly quickly.
The charts below show this week’s top candidates: In the upper section of each chart, you can see the stock’s weekly price movement; in the bottom section, you’ll see the stock’s ITV (red line) and the ITV’s 20-week moving average (blue line). These charts usually show several previous signals and could help subscribers evaluate how successful signals were in the past.

Good Trading,

January 14, 2025 - 9:57 pm
What You Can Learn from Young Warren Buffett
Charlie Munger’s wit often revealed timeless truths about investing. One of his most memorable quips was, “To be a good investor, you have to fish where the fish are. To be a great investor, though, you have to fish where the fishing boats don’t even go.”
This philosophy captures the essence of Warren Buffett’s early career, as explored in Brett Gardner’s book, Buffett’s Early Investments. The book dives into 10 companies Buffett bet on between 1950 and 1966, offering a glimpse into how he turned meticulous research, bold moves, and boundless patience into extraordinary results.
Buffett didn’t just analyze financial statements; he immersed himself in the details. He visited company headquarters, peppered managers with questions, and spent hours learning the business—whether it meant understanding barrels at Greif Bros. or gauging customer loyalty to American Express during its vegetable-oil scandal. This hands-on approach gave him insights others couldn’t see, enabling him to act when others hesitated.
Today, replicating Buffett’s methods would be almost impossible. SEC regulations prohibit executives from sharing exclusive information with select investors, and the sheer speed and efficiency of today’s markets leave little room for overlooked bargains. Yet Buffett’s approach wasn’t just about the methods—it was about the mindset.
Thinking differently, acting decisively, and daring to look where others wouldn’t are principles that remain as vital as ever.
What sets Buffett apart isn’t just his research or his courage to invest heavily in his convictions; it’s his ability to stay ahead of the crowd. Union Street Railway shares barely traded, so Buffett placed ads in local newspapers to find sellers. It took him years to accumulate a significant stake, but his persistence paid off. Similarly, he poured over half of his net worth into GEICO in 1951, convinced of its value when few others were.
Gardner’s book paints a picture of a young investor willing to go to extraordinary lengths to understand what made a company tick. This isn’t just inspiring—it’s a reminder that success comes from stepping outside the obvious and doing what others won’t.
While the rules of investing have changed, the principles of looking deeper and seizing opportunities remain timeless.
In today’s data-driven world, we have tools that bring Buffett’s philosophy into a modern context. One such tool is the Income Trader Volatility (ITV) indicator. While Buffett relied on face-to-face interactions and on-site visits to uncover opportunities, ITV quantifies volatility in individual stocks to identify mispriced fear.
It’s not about chasing trends or reacting to market noise; it’s about recognizing when uncertainty has pushed options premiums higher than they should be—and turning that into a steady income stream.
The ITV indicator offers something Buffett always championed: simplicity with substance. High ITV levels often coincide with market bottoms, signaling a chance to sell options at inflated premiums. On the other hand, low ITV levels help traders avoid crowded trades and wait for better opportunities.
This isn’t guesswork—it’s a systematic approach to navigating today’s complex markets with the same conviction that Buffett displayed decades ago.
Buffett’s story reminds us that great investing isn’t about being the loudest or the fastest—it’s about seeing what others miss. Whether you’re finding undervalued companies in the 1960s or leveraging volatility insights today, the key is the same: act boldly, think independently, and always fish where others don’t.

PVH Corp. (PVH) is trading above its strike price and on track to expire worthless next month.
The Top Instant Income Opportunities This Week
Below you will find the top trade candidates identified by the Income Trader Volatility (ITV) indicator. Each of these trades recommends selling (to open) a put option. If you’re looking to make additional Instant Income trades, I can’t think of a better list of stocks to start your research.
Bonus trades have less stringent risk parameters, and these trades have slightly more risk than trades I recommend for the Income Trader portfolio. Risk is still relatively low in a bonus trade, but it is not low enough to pass my most rigorous screens. We recommend closing all bonus trades when they trade at $ 0.10 or below.

I always recommend the use of limit orders when entering an options trade. A limit at the midpoint between the bid and ask prices will often be filled fairly quickly.
The charts below show this week’s top candidates: In the upper section of each chart, you can see the stock’s weekly price movement; in the bottom section, you’ll see the stock’s ITV (red line) and the ITV’s 20-week moving average (blue line). These charts usually show several previous signals and could help subscribers evaluate how successful signals were in the past.


Good Trading,
January 8, 2025 - 5:00 am
Coach Saban’s Legacy: The Process for Trading Success
Growing up as an Alabama football fan, I’ve always admired Nick Saban’s relentless pursuit of excellence. Even in retirement, his philosophy and commitment to the process continue to inspire.
Saban often said, “We live in such an outcome-oriented world. People want to focus on outcomes, and I think outcomes are a bit of a distraction.” For him, success wasn’t about the final score — it was about focusing on the small, consistent steps that led to winning.
In trading, the same philosophy applies. Focusing solely on profits or the end result can lead to impulsive decisions, overtrading, or abandoning a sound strategy in favor of chasing quick wins. Success isn’t built on outcomes; it’s built on the process.
For us, that means executing each trade correctly, managing risk with precision, and staying true to the framework we’ve developed with the ITV put selling strategy.
This disciplined approach is how we achieved a 100 % win rate in 2024. By staying focused on the ITV process and refusing to let distractions derail us, we navigated challenging markets and delivered consistent success. As we head into 2025, we will continue to trust this proven framework and strive for the same level of excellence.
Saban also emphasized the importance of building a culture — the mindset and habits that define how a team operates. In trading, our culture revolves around discipline and consistency.
This includes trusting our strategy, following the parameters we’ve tested over time, and prioritizing capital preservation over emotional reactions to market noise. It also means embracing continuous improvement, reviewing each trade, and refining execution based on lessons learned.
One of the most significant challenges Saban identified is discipline. As he put it, “You have to do things the right way yourself… because it requires a commitment.”
Discipline in trading means adhering to the process even when it’s difficult. It’s about holding off on trades that don’t meet the ITV criteria, no matter how tempting they may seem. It’s about resisting the urge to react emotionally to short-term fluctuations in the market. And it’s about staying the course during tough weeks when results don’t align with expectations.
Our success in 2024 wasn’t luck — it was the result of small, consistent actions taken every day. Stay focused, trust the strategy, and remember that the results we’re after in 2025 will come from the same disciplined approach. As Saban often said, “If you have the discipline to execute every day, you can achieve great things.”
Today’s Trade: Generate 2.7% In PVH
Currently, PVH is trading around $ 105.16. This week, I recommend selling (to open) PVH Feb-21 $ 90 Puts for $ 0.50 – $ 0.75. That’s a put option on PVH with a strike price of $ 90 that expires on February 21, 2025 (PVH250221P00090000 ).

When entering the trade, I recommend using a limit order near or below the current ask price of the option. (A price quote will include a bid and ask price; trades are often completed between these two prices.)
For example, if the current quote on this option is “bid $ 0.60, ask $ 0.70,” I would suggest using a limit order to sell at $ 0.65. If that order is not filled within a few hours, you could lower the limit price based on the current quote. A limit order at this level will usually be filled quickly.
No matter what the current bid and ask prices are, I do not recommend trading outside the limit I set for the trade. For this trade, your limit price should be between $ 0.50 and $ 0.75.
As soon as your trade is executed, you will generate immediate income of about $ 50 (each contract controls 100 shares), assuming you enter the trade at the bottom of the range. (I’m using the bottom of the range because that’s the least amount of income we’ll accept for this trade, which gives us the most conservative estimate of our return.)
Selling this put will obligate you to buy PVH at $ 90 a share if the stock trades for less than that on February 21 (the last day these options can be traded).
Buying 100 shares of PVH at $ 90 each would cost $ 9,000. To initiate this trade, your broker will likely require you to deposit a percentage of that obligation in your account, like a down payment on a house.
This is called a “margin requirement.” It usually runs about 20% of the amount it would cost you to buy the shares. This PVH trade would require a margin deposit of $ 1,800 (20% of $ 9,000).
Here’s how the trade looks if the option expires worthless:

Assuming PVH trades for $ 90 or more on February 21, we keep the premium and make a profit of $ 50 on $ 1,800, or 2.7%, in 44 days. If we can repeat a similar trade every 44 days, we will earn about 22.3% on our capital in 12 months.
Recommended Trade: Sell PVH Feb-21 $ 90 Puts for $ 0.50 – $ 0.75. Remember, each option contract you sell represents a potential obligation to purchase 100 shares of PVH. If you’re not comfortable owning more than 100 shares of PVH, don’t sell more than one put.
I don’t recommend using a stop-loss on this trade. I will be monitoring it closely and will send an immediate update if anything changes.
As always, I recommend readers use limit orders to execute trades. If prices move and you can’t get the premium you want, don’t chase the trade. Income Trader is a weekly publication, so you’ll get plenty of opportunities to Generate income selling puts and covered calls.

The Top Instant Income Opportunities This Week
Below you will find the top trade candidates identified by the Income Trader Volatility (ITV) indicator. Each of these trades recommends selling (to open) a put option. If you’re looking to make additional Instant Income trades, I can’t think of a better list of stocks to start your research.
Bonus trades have less stringent risk parameters, and these trades have slightly more risk than trades I recommend for the Income Trader portfolio. Risk is still relatively low in a bonus trade, but it is not low enough to pass my most rigorous screens. We recommend closing all bonus trades when they trade at $ 0.10 or below.

I always recommend the use of limit orders when entering an options trade. A limit at the midpoint between the bid and ask prices will often be filled fairly quickly.
The charts below show this week’s top candidates: In the upper section of each chart, you can see the stock’s weekly price movement; in the bottom section, you’ll see the stock’s ITV (red line) and the ITV’s 20-week moving average (blue line). These charts usually show several previous signals and could help subscribers evaluate how successful signals were in the past.

Good Trading,
January 1, 2025 - 5:00 am
2025: A Strategy for Success in Uncertain Markets
It’s the end of another successful year for our strategy. We have now seen success when interest rates were low, relatively high, rising, and falling. It’s rare to find a strategy that succeeds in any market environment, but we have one.
That’s important because we don’t know what 2025 will bring. Analysts expect the Federal Reserve to continue cutting interest rates. Fed officials have told us that additional cuts depend on the data.
I’m concerned we could see a surprise in the data. Inflation isn’t dead and could accelerate next year. I’m most concerned about home prices, a significant driver of the last round of inflation.
We simply don’t have enough homes in our country. At the same time, the number of households continues to rise because our nation is growing. That means supply is constrained while demand is rising. This is a recipe for rising prices, according to what we all learned in Economics 101.
The supply-demand situation has been in place for several years. What concerns me is that additional Fed cuts could fuel a sharp rise in demand for homes.
Many young people feel left out of the home market. They have watched their parents grow rich from home equity. When it was time for them to buy their first home, many were priced out.
Many reacted in ways that mirrored the seven stages of grief: shock, denial, anger, bargaining, depression, testing, and acceptance.
In the home market, acceptance doesn’t mean resignation to being a lifelong renter. It means accepting that prices are high, and mortgage payments will consume more of their household income than they wished for.
That should drive buyers into the market as mortgage rates fall. A 0.5% drop in rates could mean a 5% decline in the payment amount or the ability to buy 5% more house. Either way a potential buyer looks at it, there is likely to be a feeling that homes are more affordable as rates fall.
Higher home prices, driving higher inflation, could drive the Fed to change policy. They could stop cutting rates and, if the numbers dictate, they could raise rates next year.
The only thing certain about 2025 is that there are risks. Based on history, we should be able to navigate those risks.
 The Top Instant Income Opportunities This Week
Below you will find the top trade candidates identified by the Income Trader Volatility (ITV) indicator. Each of these trades recommends selling (to open) a put option. If you’re looking to make additional Instant Income trades, I can’t think of a better list of stocks to start your research.
Bonus trades have less stringent risk parameters, and these trades have slightly more risk than trades I recommend for the Income Trader portfolio. Risk is still relatively low in a bonus trade, but it is not low enough to pass my most rigorous screens. We recommend closing all bonus trades when they trade at $ 0.10 or below.

I always recommend the use of limit orders when entering an options trade. A limit at the midpoint between the bid and ask prices will often be filled fairly quickly.
The charts below show this week’s top candidates: In the upper section of each chart, you can see the stock’s weekly price movement; in the bottom section, you’ll see the stock’s ITV (red line) and the ITV’s 20-week moving average (blue line). These charts usually show several previous signals and could help subscribers evaluate how successful signals were in the past.

Good Trading,
December 25, 2024 - 8:00 am
Sentiment Shift Hints at Bullish Potential
Sentiment shifted last week. We’re seeing that in the data.
One source of sentiment data is surveys like one done by the American Association of Individual Investors, or AAII.
Every week since 1987, AAII conducts a survey.
There’s just one question. Are you bullish, bearish or neutral about the next six months?
The long history allows us to test the usefulness of the data. For a survey with many design problems, the data is surprisingly useful.
In an average week, 37.5% of investors are bullish, 31% are bearish and 31.5% are neutral.
Last week, about 41% were bullish,282% were bearish and 31% were neutral. The levels aren’t as important as the trend shown in the chart below.

Bullish sentiment has been falling since July but the pace accelerated in the past two weeks. The shift has been to neutral rather than bearish. That’s moderately bullish for stocks.
Bearish sentiment tends to mean investors are looking for strong evidence that prices are likely to rise. It can be difficult to change a bear’s mind.
Neutral is simply “not sure.” In normal market conditions, these investors are most likely equally worried about missing the next up move or down move.
But these aren’t normal market conditions. We see that the increase in neutral came from the bullish camp. About 7.6% of the investors in the survey dropped their bullish outlook as the neutral group rose by 6.9%.
These investors are likely to be looking for a reason to be bullish because that was the most recent opinion they held. That indicates just a little good news could unlock a surge of buying power.
That outlook is consistent with the Income Trader Volatility (ITV) indicator. ITV is at the bottom of the next chart. This is a daily chart of SODR S&P 500 ETF (SPY).

What I noticed on the chart is last week’s surge in ITV. That was a result of the Federal Reserve’s meeting. Fed officials lowered expectations for rate cuts next year. Instead of four, officials now expect two. That sent stocks lower and ITV higher.
The vertical blue line shows previous high readings in ITV. Dashed vertical lines show where SPY was at the first high reading.
These signals have tended to be a little early but they consistently precede short-term buying opportunities.
The news from the Fed may have been bad for traders but the news from ITV, like sentiment, is moderately bullish.

PulteGroup, Inc. (PHM) was closed early for a gain.
The Top Instant Income Opportunities This Week
Below you will find the top trade candidates identified by the Income Trader Volatility (ITV) indicator. Each of these trades recommends selling (to open) a put option. If you’re looking to make additional Instant Income trades, I can’t think of a better list of stocks to start your research.
Bonus trades have less stringent risk parameters, and these trades have slightly more risk than trades I recommend for the Income Trader portfolio. Risk is still relatively low in a bonus trade, but it is not low enough to pass my most rigorous screens. We recommend closing all bonus trades when they trade at $ 0.10 or below.
We have no bonus trades this week. I will screen again next week and look for new trading opportunities.
Happy Holidays!
December 17, 2024 - 9:13 pm
Stocks Rise, But Economic Red Flags Loom
Stocks continue moving higher. But it’s time to worry. Economic data is warning of a potential slowdown next year.
Industrial production is down 0.7% year-to-date and manufacturing capacity utilization is at a seven-year low (excluding the pandemic). Production declined on a year-over-year basis in each of the past five months and in ten of the past twelve months.

Analysts had expected a month-over-month increase in November as factories made up for lost time after storms and strikes in October idled production lines. The number came in at just 0.2%.
Capacity utilization in the manufacturing sector is at 76.8%. Excluding the pandemic, usage has not been that low since 2017. This number shows how much slack there is in the economy and indicates almost a quarter of industrial capacity is sitting idle.
This would be good news for the Federal Reserve since industrial production isn’t inflationary. Unfortunately, consumers are still spending.
In November, auto sales jumped 2.6% and ecommerce, posted a gain of 1.8%. For the sixth month in a row, retail sales came in better than expectations in November, this time for a gain of 0.7%.
Strong consumer demand creates price pressure that is making the Fed’s 2.0% inflation target difficult to achieve. Until the consumer slows down, the Fed will be unable to reduce rates too far. Higher rates will slow the consumer eventually since that reduces the purchase of big ticket items except when replacement is necessary.
I’m certain Fed officials talked about this data at this week’s meeting. The need to boost industrial production while slowing consumer demand creates unique challenges. If the Fed doesn’t lower rates, they can’t boost industrial production. If they lower rates too much, consumers will drive higher inflation.
It’s a challenging economic environment that we will navigate with a short-term focus. I do have one bonus trade for you this week and will be back next week with new trading opportunities.

The Top Instant Income Opportunities This Week
Below you will find the top trade candidates identified by the Income Trader Volatility (ITV) indicator. Each of these trades recommends selling (to open) a put option. If you’re looking to make additional Instant Income trades, I can’t think of a better list of stocks to start your research.
Bonus trades have less stringent risk parameters, and these trades have slightly more risk than trades I recommend for the Income Trader portfolio. Risk is still relatively low in a bonus trade, but it is not low enough to pass my most rigorous screens. We recommend closing all bonus trades when they trade at $ 0.10 or below.

I always recommend the use of limit orders when entering an options trade. A limit at the midpoint between the bid and ask prices will often be filled fairly quickly.
The charts below show this week’s top candidates: In the upper section of each chart, you can see the stock’s weekly price movement; in the bottom section, you’ll see the stock’s ITV (red line) and the ITV’s 20-week moving average (blue line). These charts usually show several previous signals and could help subscribers evaluate how successful signals were in the past.

Good Trading,

December 11, 2024 - 12:03 am
Year-End Volatility Trends and Market Impact
I want to start with a chart this week. Below is a chart of the seasonal trend in volatility. It’s the blue line.

VIX represents the volatility of the broad market. It measures the expected volatility of the S&P 500 and it’s been trending down for the past two months.
This is important for two reasons.
First, is the fact that lower volatility is bullish for prices.
Volatility reflects fear, which is why VIX is popularly known as the Fear Index. That’s because when prices fall, some traders panic. They act on that panic by buying put options on the S&P 500. That pushes up VIX.
When VIX is falling, traders are complacent, and they aren’t protecting their portfolios with puts. This leads to a lower VIX.
The second reason this is important is because of that complacency. Traders often reduce their activity at the end of the year. Some do it because they have a large gain and protecting that gain helps lock in their bonus. Others are on vacation. The reasons vary but volume tends to drop at this time of year.
This means we might have difficulty trading. That shouldn’t be a problem for us because I always use liquid stocks and market makers are likely to accept our orders. But it could affect you in less liquid stocks.
At the bottom of the chart is the accuracy of the trend. This is one of the strongest periods of the VIX trend. The Index declines about 65% of the time into the end of the year.
That means there is about a one-third probability of a decline this month.
That’s why we can’t grow complacent. I’ll be watching the markets and our positions even during the holiday season.

PulteGroup, Inc. (NYSE: PHM) is trading above our strike price and is on track to deliver a gain next week.
The Top Instant Income Opportunities This Week
Below you will find the top trade candidates identified by the Income Trader Volatility (ITV) indicator. Each of these trades recommends selling (to open) a put option. If you’re looking to make additional Instant Income trades, I can’t think of a better list of stocks to start your research.
Bonus trades have less stringent risk parameters, and these trades have slightly more risk than trades I recommend for the Income Trader portfolio. Risk is still relatively low in a bonus trade, but it is not low enough to pass my most rigorous screens. We recommend closing all bonus trades when they trade at $ 0.10 or below.

I always recommend the use of limit orders when entering an options trade. A limit at the midpoint between the bid and ask prices will often be filled fairly quickly.
The charts below show this week’s top candidates: In the upper section of each chart, you can see the stock’s weekly price movement; in the bottom section, you’ll see the stock’s ITV (red line) and the ITV’s 20-week moving average (blue line). These charts usually show several previous signals and could help subscribers evaluate how successful signals were in the past.


Good Trading,
December 3, 2024 - 8:30 pm
Lessons from South Korea’s Political Turmoil
I want you to be among the first to know that I am working on a new strategy. I have some details at the end of this note. But, first, let’s look at some news, and how it affected the market.
The announcement of martial law in South Korea was unexpected, dramatic, and sent shockwaves through both the political and financial landscapes.
President Yoon Suk Yeol placed the country under martial law, citing domestic opposition and national security threats.
iShares MSCI South Korea ETF (EWY) fell more than 8.5% on the news. But the markets recovered most of those losses by the end, At the close, EWY was down just 1.6%.
Bitcoin also fell on the news, falling about 2.4% before recovering all of its losses by the time stocks closed for the day in the US. Bitcoin, of course, trades for 24 hours. That means we could see additional moves as the situation changes in Seoul.
And the situation has been changing rapidly. The legislature voted against martial law. The military seemed to be siding with the president. There were even videos of soldiers entering the parliament building. It looked to me like many of the soldiers were carrying unloaded weapons in the videos I saw so I’m not sure what the purpose of that was.
As I type this, the president has declared an end to martial law, and maybe things will go back to normal.
Those with a longer-term perspective may be thinking about Baron Nathan Rothschild’s famous investment advice to buy when there’s blood in the streets. There was no bloodshed in this crisis, but it certainly was a dramatic display of force. It looks like it could be time to buy.
Or you may be thinking about that other piece of investment advice that is attributed to the very same Baron Rothschild to “buy on the cannons, sell on the trumpets.” The end of martial law is the sound of trumpets, so a time to sell.
This is why I use indicators. Here the message is clear. EWY gave a sell signal based on my Income Trader Volatility indicator last week when it crossed above its moving average.

I normally look at ITV to sell puts and we sell puts, a bullish trade, when the indicator falls below its moving average. My research has shown that this is a versatile indicator that can be applied in a variety of ways.
Over the next few weeks, I’ll be telling you more about my newest application. I’ll share some of the details in a presentation next week. You can join me by clicking here to register.
Puts: Portfolio & Updates

Discover Financial Services (NYSE: DFS) was closed early for a gain.
PulteGroup, Inc. (NYSE: PHM) is trading above our strike price and on track to deliver a gain.
The Top Instant Income Opportunities This Week
Below you will find the top trade candidates identified by the Income Trader Volatility (ITV) indicator. Each of these trades recommends selling (to open) a put option. If you’re looking to make additional Instant Income trades, I can’t think of a better list of stocks to start your research.
Bonus trades have less stringent risk parameters, and these trades have slightly more risk than trades I recommend for the Income Trader portfolio. Risk is still relatively low in a bonus trade, but it is not low enough to pass my most rigorous screens. We recommend closing all bonus trades when they trade at $ 0.10 or below.

I always recommend the use of limit orders when entering an options trade. A limit at the midpoint between the bid and ask prices will often be filled fairly quickly.
The charts below show this week’s top candidates: In the upper section of each chart, you can see the stock’s weekly price movement; in the bottom section, you’ll see the stock’s ITV (red line) and the ITV’s 20-week moving average (blue line). These charts usually show several previous signals and could help subscribers evaluate how successful signals were in the past.

Remember, I would like you to join me at next week’s presentation. If you haven’t registered, please click here.
Good Trading,

November 26, 2024 - 8:32 pm
What Working Undercover Taught Me About Momentum
I was young, just 22. Was never arrested. Didn’t know anyone who had been. Somehow, that qualified me to work undercover in law enforcement. My first assignment: make friends with criminals.
Training was brief. I was told to stay out of danger and gather evidence. My supervisor said I needed to figure out the details on my own. If I used her approach, it wouldn’t seem natural. And If I seemed uncomfortable, I wouldn’t be effective. She didn’t need to say the rest. I already knew. If I didn’t fit in, I could get hurt.
I wish I could say it was fun to work undercover. But it’s not. It’s stressful. A mistake could blow the operation and let the bad guys go free. A mistake could also change my life since they were pretty bad guys.
So, I focused on the task at hand. I developed my own techniques. I learned to be comfortable in uncomfortable situations. And we made the arrests.
What does that have to do with trading? Everything.
I need to focus on the task. For traders, that’s finding and managing winning trades. If I use someone else’s techniques, I won’t be comfortable. That causes losses. Mistakes also lead to losses. One big difference – losses don’t lead to physical harm.
Just like in undercover work, it’s tempting to use other people’s techniques. There are so many techniques out there. It’s easy to find one that seems good. Over the years, I have worked with great traders and analysts. They had great tools.
They just weren’t my tools. I knew I could find a better way, one that made me more comfortable.
Many trading tools, in fact almost all of them, are based on momentum. I studied that to learn why that works. I also studied options and as a new trader, found options appealing because I had limited capital. My studies showed me that momentum was a little different in options markets.
Volatility is important in options pricing. When volatility is high, premiums are high. I focused on that idea. Within a few years, I developed an indicator that spotted changes in volatility. I was still young and needed income, so I applied this to selling options.
The indicator showed when volatility was shifting from high to low. That was the perfect time to sell an option. My signal maximized income while reducing risk. You can read my paper on this idea https://papers.ssrn.com/sol3/papers.cfm?abstract_id=2577930
Testing showed me this indicator is also a momentum indicator. That makes sense. High volatility marks fast price moves. I showed results of some tests in the paper. With weekly data, this simple tool beats buy and hold with less risk. And it doesn’t require a lot of effort to follow weekly data.
Below is a chart of the SPDR S&P 500 ETF (SPY) with my indicator at the bottom. It’s been volatile most of the year. Now, it’s at that very low level associated with strong rallies like we saw last summer.

I’m optimistic that this rally has the potential to continue, and I’ll be guided by my indicator.
However, my experience working undercover taught me the importance of caution. If the rally loses steam, my indicator is designed to protect against significant losses.

Discover Financial Services (NYSE: DFS) was closed early for a gain.
PulteGroup, Inc. (NYSE: PHM) is trading above our strike price and on track to deliver a gain.
The Top Instant Income Opportunities This Week
Below you will find the top trade candidates identified by the Income Trader Volatility (ITV) indicator. Each of these trades recommends selling (to open) a put option. If you’re looking to make additional Instant Income trades, I can’t think of a better list of stocks to start your research.
Bonus trades have less stringent risk parameters, and these trades have slightly more risk than trades I recommend for the Income Trader portfolio. Risk is still relatively low in a bonus trade, but it is not low enough to pass my most rigorous screens. We recommend closing all bonus trades when they trade at $ 0.10 or below.

I always recommend the use of limit orders when entering an options trade. A limit at the midpoint between the bid and ask prices will often be filled fairly quickly.
The charts below show this week’s top candidates: In the upper section of each chart, you can see the stock’s weekly price movement; in the bottom section, you’ll see the stock’s ITV (red line) and the ITV’s 20-week moving average (blue line). These charts usually show several previous signals and could help subscribers evaluate how successful signals were in the past.

Thanksgiving reminds us to pause and reflect on the things we’re grateful for. I’m thankful for the opportunity to share my insights with you and for the trust you place in my work. Wishing you and your loved ones a wonderful week filled with joy, gratitude, and success.
Good Trading,
November 19, 2024 - 9:30 pm
Can Trading Be Your Side Hustle to Financial Freedom?
I was asked an interesting question this week:
“Do you think it’s possible to achieve financial security through trading? Has your trading let you live debt-free?”
Let me start with the usual disclaimers: I’m not a financial advisor. Personal financial decisions are personal—your goals, risk tolerance, and definition of financial security are unique to you. What works for me might not be right for you.
That said, here’s my take.
I don’t like debt, and I believe the standard advice of paying it down as quickly as possible, is solid. Making extra income is important, and trading offers a way to do that. I’ve seen a lot of advice online about side hustles—buying vending machines, power washers, etc. and while those can work, they require upfront investments, just like trading.
The difference? I believe trading offers more control. I know the exact risks of a trade when I enter it, I always have a plan, and I stick to it. A power washer doesn’t come with a risk management plan, and I’m not sure vending machines handle downturns better than a well-executed trade.
Trading has allowed me to build the life I dreamed of when I was in the Army. Back in Iraq, we all talked about our post-deployment plans. Mine? Work with a friend in the financial markets. I had no backup plan and no experience—just a commitment to learning everything I could. It worked better and faster than I expected.
Trading isn’t for everyone, but neither are side hustles. If you’re considering ways to build financial security, I think trading deserves a place at the table.
Now, let’s get back to it..
Today’s Trade: Generate 2.2% In PHM
Currently, PHM is trading around $ 128.51. This week, I recommend selling (to open) PHM Dec-20 $ 110 Puts for $ 0.50 – $ 0.75. That’s a put option on PHM with a strike price of $ 110 that expires on December 20, 2024 (PHM241220P00110000).

When entering the trade, I recommend using a limit order near or below the current ask price of the option. (A price quote will include a bid and ask price; trades are often completed between these two prices.)
For example, if the current quote on this option is “bid $ 0.60, ask $ 0.70,” I would suggest using a limit order to sell at $ 0.65. If that order is not filled within a few hours, you could lower the limit price based on the current quote. A limit order at this level will usually be filled quickly.
No matter what the current bid and ask prices are, I do not recommend trading outside the limit I set for the trade. For this trade, your limit price should be between $ 0.50 and $ 0.75.
As soon as your trade is executed, you will generate immediate income of about $ 50 (each contract controls 100 shares), assuming you enter the trade at the bottom of the range. (I’m using the bottom of the range because that’s the least amount of income we’ll accept for this trade, which gives us the most conservative estimate of our return.)
Selling this put will obligate you to buy PHM at $ 110 a share if the stock trades for less than that on December 20th (the last day these options can be traded).
Buying 100 shares of PHM at $ 110 each would cost $ 11,000. To initiate this trade, your broker will likely require you to deposit a percentage of that obligation in your account, like a down payment on a house.
This is called a “margin requirement.” It usually runs about 20% of the amount it would cost you to buy the shares. This PHM trade would require a margin deposit of $ 2,200 (20% of $ 11,000).
Here’s how the trade looks if the option expires worthless:

Assuming PHM trades for $ 110 or more on December 20th, we keep the premium and make a profit of $ 50 on $ 2,200, or 2.2%, in 30 days. If we can repeat a similar trade every 30 days, we will earn about 26.7% on our capital in 12 months.
Recommended Trade: Sell PHM Dec-20 $ 110 Puts for $ 0.50 – $ 0.75. Remember, each option contract you sell represents a potential obligation to purchase 100 shares of PHM. If you’re not comfortable owning more than 100 shares of PHM, don’t sell more than one put.
I don’t recommend using a stop-loss on this trade. I will be monitoring it closely and will send an immediate update if anything changes.
As always, I recommend readers use limit orders to execute trades. If prices move and you can’t get the premium you want, don’t chase the trade. Income Trader is a weekly publication, so you’ll get plenty of opportunities to Generate income selling puts and covered calls.

Discover Financial Services (NYSE: DFS) was closed early for a gain.
The Top Instant Income Opportunities This Week
Below you will find the top trade candidates identified by the Income Trader Volatility (ITV) indicator. Each of these trades recommends selling (to open) a put option. If you’re looking to make additional Instant Income trades, I can’t think of a better list of stocks to start your research.
Bonus trades have less stringent risk parameters, and these trades have slightly more risk than trades I recommend for the Income Trader portfolio. Risk is still relatively low in a bonus trade, but it is not low enough to pass my most rigorous screens. We recommend closing all bonus trades when they trade at $ 0.10 or below.
No bonus trades passed our screening process this week, mainly due to upcoming earnings.
Good Trading!
November 12, 2024 - 6:27 pm
Election Sparks Market Optimism as Gold Falls
Stocks have been moving higher since last week’s election. Other markets are also reacting bullishly to the news.
Gold prices are falling. The chart below shows SPDR Gold Shares (GLD), an ETF that tracks the price of gold. Ten shares of GLD represent one ounce of gold. The trend, even before the election, was down.

Gold is an inflation hedge. Recent weakness indicates traders are less worried than they were a few weeks ago.
This might not make sense at first glance. Headlines tell us tariffs will be inflationary. Other headlines tell us tax cuts will be inflationary. All these writers overlook some basic economics.
Inflation, in the words of Milton Friedman, is a monetary phenomenon. When the amount of money increases, prices go up. That makes sense because it boils down to the idea that there is more money chasing the same amount of goods so prices will rise.
Tariffs would be inflationary if they increased the price of everything and the Federal Reserve created more money so consumers could pay higher prices.
Under Federal Reserve Chairman Jerome Powell, we have less insight into monetary data. In May 2020, as inflation started accelerating, the Fed stopped providing weekly updates on the money supply. All we have is monthly data now but the trend in money creation is positive.

At the height of the pandemic, the government was spending trillions of dollars. The Fed was accommodative, and the money supply was growing at more than 25% a year by early 2021. Last year, the money supply declined. This year, the pace of growth is about half of what it was before the pandemic.
Without the Fed’s cooperation, tariffs and tax cuts don’t need to be inflationary. It’s possible policy makers could work together to grow the economy without creating inflation.
That’s unlikely, but for now the gold market is telling us it’s possible. Bond traders are also optimistic, pushing interest rates down since the election. Lower rates are also associated with lower inflation.
If traders believe the economy is moving in the right direction, stock prices should go up. We’ll participate in that trend the way we always do, conservatively with an understanding that trends can change quickly.

Discover Financial Services (NYSE: DFS) is trading below $CONTENT.10 and should be closed early for a gain.
The Top Instant Income Opportunities This Week
Below you will find the top trade candidates identified by the Income Trader Volatility (ITV) indicator. Each of these trades recommends selling (to open) a put option. If you’re looking to make additional Instant Income trades, I can’t think of a better list of stocks to start your research.
Bonus trades have less stringent risk parameters, and these trades have slightly more risk than trades I recommend for the Income Trader portfolio. Risk is still relatively low in a bonus trade, but it is not low enough to pass my most rigorous screens. We recommend closing all bonus trades when they trade at $ 0.10 or below.
 I always recommend the use of limit orders when entering an options trade. A limit at the midpoint between the bid and ask prices will often be filled fairly quickly.
The charts below show this week’s top candidates: In the upper section of each chart, you can see the stock’s weekly price movement; in the bottom section, you’ll see the stock’s ITV (red line) and the ITV’s 20-week moving average (blue line). These charts usually show several previous signals and could help subscribers evaluate how successful signals were in the past.
Good Trading,
November 5, 2024 - 9:36 pm
From Soldier to Trader: Lessons in Risk
I decided to become a trader while I was in the military. I quickly realized that my time in the military put me at a disadvantage. I would be older and less experienced than traders who started their careers right out of college, and I wouldn’t have the advantage of a degree from a prestigious university. I knew I needed to figure out another way to compete.
From my military experience, I learned that experience is the best teacher. In the field, experience showed its value. I decided to find experienced traders and learn from them. You’re probably thinking that’s a good plan but wondering how to find experienced people in a new career. I picked up the phone and called a trader I knew, who gave me the name of someone else. That person provided additional contacts, and I ended up speaking to dozens of seasoned traders.
One of my favorites would call frequently. He had many pithy phrases summarizing decades of experience. One of them was, “There are two kinds of people in the world—those that don’t know, and those that don’t know they don’t know. The second kind is dangerous.”
This was something I immediately understood from my military experience. I knew I didn’t know everything, which is why I sought the opinions of experienced leaders. I saw many people who didn’t realize they didn’t know; they created risks for everyone around them.
The markets are the same way. I understand that I don’t know all the risks. I take every step I can to mitigate those risks, remaining vigilant to react if something unexpected happens. I have plans for different scenarios and have mentally rehearsed for many events. But I know I don’t know everything, so I am constantly studying and evaluating the markets.
Unfortunately, I might be one of the few market analysts willing to admit I don’t know everything this week. I don’t know the results of the election or the outcome of this week’s Federal Reserve meeting. All I know is that there are risks, and now is the time to respect them. My strategy is risk-averse, and I’m not changing that now.

Discover Financial Services (NYSE: DFS) is on track to expire worthless later this month.
The Top Instant Income Opportunities This Week
Below you will find the top trade candidates identified by the Income Trader Volatility (ITV) indicator. Each of these trades recommends selling (to open) a put option. If you’re looking to make additional Instant Income trades, I can’t think of a better list of stocks to start your research.
Bonus trades have less stringent risk parameters, and these trades have slightly more risk than trades I recommend for the Income Trader portfolio. Risk is still relatively low in a bonus trade, but it is not low enough to pass my most rigorous screens. We recommend closing all bonus trades when they trade at $ 0.10 or below.

I always recommend the use of limit orders when entering an options trade. A limit at the midpoint between the bid and ask prices will often be filled fairly quickly.
The charts below show this week’s top candidates: In the upper section of each chart, you can see the stock’s weekly price movement; in the bottom section, you’ll see the stock’s ITV (red line) and the ITV’s 20-week moving average (blue line). These charts usually show several previous signals and could help subscribers evaluate how successful signals were in the past.
 Good Trading,
October 29, 2024 - 11:26 pm
Gold Surges Amid Uncertain Market Signals
Gold is reaching new highs. A recent Bloomberg article listed some reasons why this shouldn’t be happening.
Interest rates are down. This is generally bearish for gold, simply because lower interest rates are associated with lower inflation. You may remember that interest rates consist of three factors: a return on investment, a risk premium to compensate investors for the possibility of a default, and an inflation premium.
Inflation expectations generally change the most and account, in theory, for much of the volatility in rates. Lower rates imply lower inflation, and that should be bad for gold, in theory.
But interest rate trends depend on which rate you are looking at. Short-term rates are declining because the Federal Reserve is cutting rates. Longer-term rates, like those on 10-year Treasurys, are up from 3.6% in mid-September to 4.2% this week. That’s a sharp rise and shows that inflation is a concern for bond traders looking at the long term.
The dollar is strong. Their theory is that a weak dollar benefits gold. That may be true. But the dollar reflects a variety of factors.
In times of global stress, many traders buy dollars to protect against uncertainty. I think that we can describe the current state of the world as uncertain, and that could explain the strength in the dollar. In fact, I’d argue the news from the Middle East combined with election uncertainty explains why gold is going up. It’s a hedge against unknown risks.
Bloomberg is also concerned with economic news, noting, “…US job openings fell far more than expected while consumer confidence rose above all estimates.” Later, the author noted, “Recent data points to the resilience of the US economy, keeping the debate alive on how deep the Fed may cut rates for the rest of the year.”
My takeaway is that there are reasons to expect the rally in gold to continue. There are also reasons to expect the market to retreat from its all-time highs.
In the end, I’m more confident that a rules-based approach is always the best way to trade the markets. That’s especially true when it’s an approach that has withstood the test of time, as our income strategy has.

Discover Financial Services (NYSE: DFS) is on track to expire worthless next month.
The Top Instant Income Opportunities This Week
Below you will find the top trade candidates identified by the Income Trader Volatility (ITV) indicator. Each of these trades recommends selling (to open) a put option. If you’re looking to make additional Instant Income trades, I can’t think of a better list of stocks to start your research.
Bonus trades have less stringent risk parameters, and these trades have slightly more risk than trades I recommend for the Income Trader portfolio. Risk is still relatively low in a bonus trade, but it is not low enough to pass my most rigorous screens. We recommend closing all bonus trades when they trade at $ 0.10 or below.

I always recommend the use of limit orders when entering an options trade. A limit at the midpoint between the bid and ask prices will often be filled fairly quickly.
The charts below show this week’s top candidates: In the upper section of each chart, you can see the stock’s weekly price movement; in the bottom section, you’ll see the stock’s ITV (red line) and the ITV’s 20-week moving average (blue line). These charts usually show several previous signals and could help subscribers evaluate how successful signals were in the past.

Good Trading,
October 22, 2024 - 8:49 pm
My Strategy for Protecting Income and Avoiding Stock Losses
I always enjoy hearing from you. It’s been a pleasure helping many of you pursue your financial goals, and I love hearing about how you’ve used your gains. I also appreciate the feedback you share, as I’m always striving to improve.
This week, I received an email that I think will interest everyone. Dale G. wrote:
“I’ve been using Amber Hestla’s recommendations for over three years and am very happy with the results. However, I have a concern. When a recession hits, following her technique, we will most likely be put the stocks on which we sold options. In a recession, we may have to hold on to them for 18-36 months. I see this as the only downside to her strategy, but it could be a major limitation for future earnings. Is this something Amber has considered as we approach a potential recession?”
First, I want to thank Dale for his question. It gives me the opportunity to address a few points that I probably should have mentioned earlier.
I do agree that a recession is likely at some point. However, I follow the data closely and will not act until the numbers signal a downturn. For now, the data indicates the economy is still expanding. This includes employment data, though I admit some of it seems weaker than reported, and revisions are common. Still, the broader picture remains positive—for now.
Dale’s question about trading during a recession is key.
It’s unlikely we’ll be put into shares from our positions. When faced with that risk, I almost always recommend closing the position at a loss before it worsens. This is often the most cost-effective way to exit.
Being exercised means you’d own the stock with an immediate loss, and the conditions that caused the stock to fall may continue, leading to further losses. This is an important point: if the stock falls enough to reach the exercise price, something significant has changed. Whatever caused that shift is likely to persist, so cutting losses early is crucial for long-term success—this applies to income strategies as well as speculative trades.
You might be able to hold on and break even after a few years, but that’s a lot of wasted time. Instead, by taking the loss and finding new opportunities in the current market environment, you have a better chance to see real gains.
My approach might differ from others using this strategy, but we are trading for income. My trades are designed to maximize income—not to hold long-term positions in stocks, which would require a different type of analysis. Our focus is on generating income, not building long-term stock holdings.
I believe we are well-prepared for a recession, whenever it comes. It’s possible we won’t see any losses, or we may face a few that we can recover from. But what we won’t do is accumulate stocks and watch them fall further.
Today’s Trade: Generate 2.1% In DFS
Currently, DFS is trading around $ 145.45. This week, I recommend selling (to open) DFS Nov-15 $ 115 Puts for $ 0.50 – $ 0.75. That’s a put option on DFS with a strike price of $ 115 that expires on November 15, 2024 (DFS241115P00115000).

When entering the trade, I recommend using a limit order near or below the current ask price of the option. (A price quote will include a bid and ask price; trades are often completed between these two prices.)
For example, if the current quote on this option is “bid $ 0.60, ask $ 0.70,” I would suggest using a limit order to sell at $ 0.65. If that order is not filled within a few hours, you could lower the limit price based on the current quote. A limit order at this level will usually be filled quickly.
No matter what the current bid and ask prices are, I do not recommend trading outside the limit I set for the trade. For this trade, your limit price should be between $ 0.50 and $ 0.75.
As soon as your trade is executed, you will generate immediate income of about $ 60 (each contract controls 100 shares), assuming you enter the trade at the bottom of the range. (I’m using the bottom of the range because that’s the least amount of income we’ll accept for this trade, which gives us the most conservative estimate of our return.)
Selling this put will obligate you to buy DFS at $ 115 a share if the stock trades for less than that on November 15th (the last day these options can be traded).
Buying 100 shares of DFS at $ 115 each would cost $ 11,500. To initiate this trade, your broker will likely require you to deposit a percentage of that obligation in your account, like a down payment on a house.
This is called a “margin requirement.” It usually runs about 20% of the amount it would cost you to buy the shares. This DFS trade would require a margin deposit of $ 2,300 (20% of $ 11,500).
Here’s how the trade looks if the option expires worthless:

Assuming DFS trades for $ 115 or more on November 15th, we keep the premium and make a profit of $ 50 on $ 2,300, or 2.1%, in 23 days. If we can repeat a similar trade every 23 days, we will earn about 33.3% on our capital in 12 months.
Recommended Trade: Sell DFS Nov-15 $ 115 Puts for $ 0.50 – $ 0.75.
Remember, each option contract you sell represents a potential obligation to purchase 100 shares of DFS. If you’re not comfortable owning more than 100 shares of DFS, don’t sell more than one put.
I don’t recommend using a stop-loss on this trade. I will be monitoring it closely and will send an immediate update if anything changes.
As always, I recommend readers use limit orders to execute trades. If prices move and you can’t get the premium you want, don’t chase the trade. Income Trader is a weekly publication, so you’ll get plenty of opportunities to Generate income selling puts and covered calls. For information on how to execute trades, read Profitable Trading’s Brokerage Guide.

Marathon Petroleum Corporation (NYSE: MPC) was closed last week for a gain.
The Top Instant Income Opportunities This Week
Below you will find the top trade candidates identified by the Income Trader Volatility (ITV) indicator. Each of these trades recommends selling (to open) a put option. If you’re looking to make additional Instant Income trades, I can’t think of a better list of stocks to start your research.
Bonus trades have less stringent risk parameters, and these trades have slightly more risk than trades I recommend for the Income Trader portfolio. Risk is still relatively low in a bonus trade, but it is not low enough to pass my most rigorous screens. We recommend closing all bonus trades when they trade at $ 0.10 or below.

I always recommend the use of limit orders when entering an options trade. A limit at the midpoint between the bid and ask prices will often be filled fairly quickly.
The charts below show this week’s top candidates: In the upper section of each chart, you can see the stock’s weekly price movement; in the bottom section, you’ll see the stock’s ITV (red line) and the ITV’s 20-week moving average (blue line). These charts usually show several previous signals and could help subscribers evaluate how successful signals were in the past.

Good Trading,
October 15, 2024 - 8:05 pm
Yield Curve Uninverts: Is the Recession Risk Really Over?
The yield curve is back in the news.
A yield curve is a line that shows how interest rates (or yields) change over different lengths of time. When a bank lends money to someone, they promise to repay the loan with interest. The yield curve shows the interest rates for different lengths of time. Usually, the longer the length of the loan, the higher the interest rate.
But sometimes the curve can change and inverts. That means shorter-term loans offer higher rates than long-term loans. This doesn’t usually happen at banks. Inversions do occur in the Treasury market where risks are limited.
Generally, interest rates account for risk of default. That risk rises as loans are outstanding. There’s no risk of default for Treasurys so those yields reflect only economic factors, especially inflation.
The Treasury yield curve inverts because investors think the economy might slow down or enter a recession. If that happens, they expect the Federal Reserve to lower interest rates to help the economy. As a result, investors buy more long-term bonds to lock in current rates, driving up demand and pushing down the long-term yields (interest rates on these bonds).
At the same time, the Fed might be raising short-term interest rates to fight inflation or cool off the economy. This happens because the Fed can’t really take action when they think a recession is coming. They need to set policies for current conditions. The economy is usually strong before a recession and that’s the Fed’s main worry, until the economy is clearly in a recession.
Since 2022, the yield curve has been inverted. This caused investors and analysts to worry about a recession. Recently, the 10-year to 2-year yield curve has uninverted, meaning the 10-year yield is once again higher than the 2-year, which could suggest improving economic expectations.

The problem can be seen in the chart — recessions, the grey bars in the chart, typically occur after the yield curve returns to a positive spread, so the risk of a downturn remains even after this normalization.
While the 10-year to 2-year spread uninverted, the 10-year to 3-month yield curve remains inverted. This is important because the 10-year to 3-month spread is also a strong recession predictor, and its persistent inversion suggests that short-term economic risks still exist.
Many analysts are breathing a sigh of relief about the uninversion of the yield curve. They don’t seem to be looking at the long-term chart like I am. Now is the time to start worrying about a recession.

Marathon Petroleum Corporation (NYSE: MPC) is trading below $CONTENT.10 and should be closed early for again.
The Top Instant Income Opportunities This Week
Below you will find the top trade candidates identified by the Income Trader Volatility (ITV) indicator. Each of these trades recommends selling (to open) a put option. If you’re looking to make additional Instant Income trades, I can’t think of a better list of stocks to start your research.
Bonus trades have less stringent risk parameters, and these trades have slightly more risk than trades I recommend for the Income Trader portfolio. Risk is still relatively low in a bonus trade, but it is not low enough to pass my most rigorous screens. We recommend closing all bonus trades when they trade at $ 0.10 or below.
No trades passed our screens this week. We will have new trading opportunities next week.
Good Trading,

October 8, 2024 - 8:59 pm
Microsoft Downgraded Amid AI Concerns
I saw an interesting story on Bloomberg. It’s about Microsoft:
“Microsoft Corp. shares fell in premarket trading Tuesday following a downgrade from Oppenheimer, the second such analyst cut in recent weeks.
Analyst Timothy Horan lowered his view to perform from outperform and warned that investors were too optimistic about the potential of artificial intelligence to act as a near-term tailwind for the stock.
“The Street is likely overestimating near-term AI revenues as enterprise adoption and infrastructure remains a bottleneck,” Horan wrote in a note to clients. “Enterprises have been slow to adopt AI and associated revenues will likely disappoint.”
Losses at OpenAI, which Microsoft has invested in, are a “primary concern,” he said. Those losses “could be in the -3B range in FY25, which we were not previously modeling.”
This comes after Amazon.com and apple received downgrades in the past few weeks. It seems analysts are starting to look beyond the hype associated with artificial intelligence.
Goldman Sachs is also warning about AI, telling investors that the payoff from AI is years away.
There were similar stories in the internet bubble. Some analysts started questioning the story that the internet changed everything. They began acknowledging that the internet was important but the payoffs from the large investments could be years in the future. That was the beginning of the end of the bubble.
For now, we aren’t really in an AI bubble. Some stock valuations are stretched, and major indexes are trading at the upper edge of their historic valuation ranges.
That’s a potential problem. High valuations only make sense when everything works as expected. If there are delays in product development or consumer demand is less than expected, stocks with high valuations tend to quickly become stocks with lower prices. In other words, high valuations can lead to sharp drops in prices.
This is a possibility, and as we head into earnings season, we need to be mindful of the risks. It’s possible that tech companies will reassure analysts that growth prospects remain strong, and if that happens, I’ll consider taking more aggressive positions. However, that seems unlikely, and conservative positions are more likely to pay off during the volatile times ahead.

Marathon Petroleum Corporation (NYSE: MPC) is trading above our strike price and is on track to expire worthless later this month.
The Top Instant Income Opportunities This Week
Below you will find the top trade candidates identified by the Income Trader Volatility (ITV) indicator. Each of these trades recommends selling (to open) a put option. If you’re looking to make additional Instant Income trades, I can’t think of a better list of stocks to start your research.
Bonus trades have less stringent risk parameters, and these trades have slightly more risk than trades I recommend for the Income Trader portfolio. Risk is still relatively low in a bonus trade, but it is not low enough to pass my most rigorous screens. We recommend closing all bonus trades when they trade at $ 0.10 or below.

I always recommend the use of limit orders when entering an options trade. A limit at the midpoint between the bid and ask prices will often be filled fairly quickly.
The charts below show this week’s top candidates: In the upper section of each chart, you can see the stock’s weekly price movement; in the bottom section, you’ll see the stock’s ITV (red line) and the ITV’s 20-week moving average (blue line). These charts usually show several previous signals and could help subscribers evaluate how successful signals were in the past.

Good Trading,

October 1, 2024 - 8:42 pm
Market Uncertainty: Middle East Tensions and U.S. Dockworker Strike
There’s a lot of news this week.
War in the Middle East is in the headlines. This time, we are seeing a reaction in the oil market. Oil jumped almost 4% on Tuesday when Iran launched a missile attack on Israel. That pushed oil above a barrel. Prices remain low compared to historic levels.
There are also tight polls pointing to an uncertain election in November. It’s entirely possible we could see the best possible outcome in November. That would be a split government with the parties each controlling just one half of Congress. In the past, this has been bullish because it means there is little chance of significant action from Washington. Markets tend to do best when there is little change in tax or fiscal policy.
This news has crowded out a big story — dockworkers at dozens of U.S. ports along the East Coast are striking for higher wages.
The International Longshoremen’s Association demands a 77% pay raise over six years. Port operators are offering 50%. There are other issues, but wages are at the heart of the dispute.
The walkout shuts down some of the country’s biggest sources of imports of food, vehicles, heavy machinery, construction materials, chemicals, furniture, clothes and toys.
According to The Wall Street Journal, “Big retailers, with their busy fall shopping season just starting to kick in, say that for now they can withstand the slowdown because they brought in products earlier than usual this year and diverted other cargoes to West Coast ports in case of a strike. But executives say a walkout lasting a week or longer would push up shipping costs and might trigger product shortages.
“Shoppers can rest assured holiday merchandise will be on shelves,” said Brian Dodge, president of the Retail Industry Leaders Association, which represents stores such as Best Buy, Home Depot, Gap and Dollar General. “The longer this work stoppage goes on, the harder it will become to shield customers from its effects.”
This is the first time dock workers have been on strike since 2002. That strike lasted about ten days and the S&P 500 dropped about 10% over that time. That’s why I think this is a big story traders need to follow.
This time is different. That strike occurred in a bear market that began in 2000 when the internet bubble burst. That bear market ended two days after the strike.
The end of the strike could be bullish for stocks this time, as well.
But this time really is different.
The strike comes just weeks before the election. The President can force an end to the strike. That’s what happened in 2002. Odds of that happening so close to the election seem low. Ordering workers off the picket lines could hurt the union vote which Democrats are relying on to retain control of the White House.
Knowing this, the union might feel empowered to hold out until its demands are met. That would be bearish. And that is a highly likely outcome for now.
We do need to pay attention to the Middle East and oil prices. But the election, and the strike, could have a larger impact on stocks. This is a time for caution.

Royal Caribbean Cruises Ltd. (NYSE: RCL) was closed early for a gain.
Marathon Petroleum Corporation (NYSE: MPC) is trading above our strike price and is on track to expire worthless later this month.
The Top Instant Income Opportunities This Week
Below you will find the top trade candidates identified by the Income Trader Volatility (ITV) indicator. Each of these trades recommends selling (to open) a put option. If you’re looking to make additional Instant Income trades, I can’t think of a better list of stocks to start your research.
Bonus trades have less stringent risk parameters, and these trades have slightly more risk than trades I recommend for the Income Trader portfolio. Risk is still relatively low in a bonus trade, but it is not low enough to pass my most rigorous screens. We recommend closing all bonus trades when they trade at $ 0.10 or below.

I always recommend the use of limit orders when entering an options trade. A limit at the midpoint between the bid and ask prices will often be filled fairly quickly.
The charts below show this week’s top candidates: In the upper section of each chart, you can see the stock’s weekly price movement; in the bottom section, you’ll see the stock’s ITV (red line) and the ITV’s 20-week moving average (blue line). These charts usually show several previous signals and could help subscribers evaluate how successful signals were in the past.


Before you go I want to invite you to a special event next week.
As you may realize, I have found a new home here with Investors Alley. I’ve taken a bit of time to explore some of the products they offer.
Their covered call ETF trading services got my attention since they are based on options trading, but using ETFs. These new ETFs become very popular with investors over the last year and Tim Plaehn, the dividend and income expert with Investors Alley, runs two trading services using them.
He’s offering a deep dive workshop next Tuesday – 10/08 – for you to learn more about these ETF strategies. I invite you to take a look and give it a try. Click here.
Good Trading,

September 24, 2024 - 6:50 pm
China’s Real Estate Crisis: Economic Impact and Recovery
China is in the news. Before I get to that, I want to highlight some of the problems in its economy.
The Chinese real estate sector has faced a series of significant problems, which hurts the economy because this sector was a key driver of the country’s economic growth for the past few decades. Experts estimate that around 25-30% of China’s GDP was based on construction and financing real estate developments.
Both the growth of the sector and its problems can be seen in ghost cities. For years, developers built entire urban areas in anticipation of future demand. However, building outpaced demand, and many of these areas remain under-occupied or entirely empty. This oversupply in the property market fueled financial issues.
Chinese property developers, including large firms like Evergrande, accumulated massive debt over the years to finance rapid construction projects. They relied heavily on pre-selling apartments, borrowing from banks, and issuing bonds. As these developers expanded aggressively, their debt levels reached unsustainable heights.
Evergrande defaulted on its debt in 2021 after failing to meet interest payments. This default, involving hundreds of billions of dollars worth of debt, led to a ripple effect in the broader property market, causing investors to lose confidence in other real estate firms and exposing systemic risks in the sector.
As confidence in the sector plummeted, property sales fell sharply. Many potential buyers feared that developers wouldn’t be able to complete projects. The drop in demand for homes further exacerbated the financial stress on developers, reducing cash inflows and causing delays in project completions. This led to an increase in unfinished housing projects.
As developers ran out of cash to finish construction, buyers felt trapped, and some collectively decided to stop payments, further intensifying financial pressures.
This week, China’s central bank, the People’s Bank of China, cut short-term interest rates and rates on existing mortgages, reduced minimum down payments for housing purchases, and cut bank reserve requirements, allowing banks to lend a larger proportion of their assets.
Lowering mortgage rates and down payments could increase sales in the shaky real estate market that caused the problematic loans. However, these sales could be to what we would call subprime borrowers, as banks might loosen credit standards to utilize the excess capital created. It’s a risky approach.
In this case, China might be at the leading edge of central bank thinking. Central banks have traditionally been conservative, but that approach isn’t working in China, so the PBOC is taking risks.
China’s not alone in the world; crises of some kind are present in almost every global economy—Europe is growing too slowly, and the US faces challenges in servicing debt. To grow enough to solve these problems, central banks might take risks.
In the long run, this is dangerous for the global economy. However, traders reacted to the news from China by channeling the economist John Maynard Keynes, who noted that “in the long run, we are all dead.” Chinese stocks jumped on the news, with the iShares China Large-Cap ETF (FXI) up more than 7%.
It’s important to keep in mind that we are taking short-term positions, and what traders do is more important than what we see in the long run. For now, the short run remains bullish.

Royal Caribbean Cruises Ltd. (NYSE: RCL) was closed early for a gain.
Marathon Petroleum Corporation (NYSE: MPC) is trading above our strike price and is on track to expire worthless in October.
The Top Instant Income Opportunities This Week
Below you will find the top trade candidates identified by the Income Trader Volatility (ITV) indicator. Each of these trades recommends selling (to open) a put option. If you’re looking to make additional Instant Income trades, I can’t think of a better list of stocks to start your research.
Bonus trades have less stringent risk parameters, and these trades have slightly more risk than trades I recommend for the Income Trader portfolio. Risk is still relatively low in a bonus trade, but it is not low enough to pass my most rigorous screens. We recommend closing all bonus trades when they trade at $ 0.10 or below.

I always recommend the use of limit orders when entering an options trade. A limit at the midpoint between the bid and ask prices will often be filled fairly quickly.
The charts below show this week’s top candidates: In the upper section of each chart, you can see the stock’s weekly price movement; in the bottom section, you’ll see the stock’s ITV (red line) and the ITV’s 20-week moving average (blue line). These charts usually show several previous signals and could help subscribers evaluate how successful signals were in the past.


Good Trading,
![]()
September 18, 2024 - 9:44 am
Discipline, Hard Work, and Fundamentals in Options Trading
Many of you may remember me. I founded Income Trader and provided recommendations for several years. If you were a subscriber back then, you may remember I occasionally wrote about my young boys. I wanted some time with them before school friends and activities became more important to them than their mom. They’re in school now, so when the opportunity to return to you came up, I jumped at it.
You may also recall that I provided a short commentary in each issue. While I wrote about family on a few occasions, I mostly focused on trading and the economy. I’ll continue doing that. The one thing I won’t write about is the companies we are trading.
That’s because we’re trading. It’s common for investors to want stories about their stocks, but I’ve always thought that’s dangerous. Some, if not most, individuals become more invested in the story than the stock. When the market turns against them, they cling to the story and expect a turnaround.
I don’t want to take that risk.
I could come up with interesting stories about almost every company we trade, but my concern is that some of you would then trade based on the story.
Instead, I often write about the economy or the Federal Reserve. I tie that into the broad stock market, but it doesn’t affect my trades, which are driven by strict rules. Sometimes, I also write about those rules. Other times, I explore philosophies that relate to those rules.
Some of you may remember the importance I place on reviewing the fundamentals. I see that as “spring training” for traders. In my opinion, if professional athletes take time to review the fundamentals during spring training or in training camp, it’s not too much to ask of myself to review the basics from time to time. It helps keep us sharp and ensures we stay grounded.
I also read a lot of philosophy, like a recent article in The New York Times about Troy Aikman. The article began by explaining that Aikman was tending bar in Dallas at the launch of a new beer his company distributes. He had a busy week, and he could have sent a video message. “But that’d be too easy. He hates easy.”
I liked that sentence. Aikman was a great quarterback who made it look easy, but we all know it’s not easy to play at that level. Since retiring in 2000, he’s been behind the microphone. Again, he makes it look easy. But there’s a difference between being in the broadcast booth and providing commentary to our friends in our living room. Yet, he still makes it look easy, even though it’s not.
I think that’s part of options trading. At the end of the year, we can look back at our trades, and to someone else, it might look like trading is easy. They may see win after win and steady income. But it’s not easy trading like we do. It requires research, double-checking everything, and discipline.
In addition to “hating easy,” Aikman offers a few other lessons for options traders:
- No Shortcuts: Aikman’s mantra, “No shortcuts,” is key in options trading. Just like he didn’t cut corners when developing his beer, successful traders need to put in the work. This means mastering the fundamentals, continuously analyzing market conditions, and developing well-structured trades rather than relying on luck or quick gains.
- Preparation is Everything: Aikman acknowledges that his success wasn’t due to talent alone but to his willingness to outwork others. For me, this means meticulous research and preparation. Proper analysis of the market’s behavior, implied volatility, and risk management strategies are essential. That work consumes my time, day after day, even though I only report to you once a week.
- Resilience in the Face of Challenges: Aikman embraced difficult routines to push himself, whether it was jogging in extreme heat or taking up yoga. We must accept that markets are volatile and unpredictable. When trades go south, it’s crucial to stay disciplined, adapt strategies (which sometimes includes passing on trades), and persevere through challenging periods.
- Continuous Improvement: Like Aikman’s obsession with bettering himself through biohacking and fitness, successful traders are always learning. I am constantly backtesting models, analyzing past trades, and reviewing current market conditions. The key to long-term success is a commitment to continuous growth.
I’m bringing this commitment back to you, and I’m confident we will prosper together.

Royal Caribbean Cruises Ltd. (NYSE: RCL) is trading near $ 0.10 and can be closed early for a gain.
Marathon Petroleum Corporation (NYSE: MPC) is trading above our strike price and is on track to expire worthless next month.
The Top Instant Income Opportunities This Week
Below you will find the top trade candidates identified by the Income Trader Volatility (ITV) indicator. Each of these trades recommends selling (to open) a put option. If you’re looking to make additional Instant Income trades, I can’t think of a better list of stocks to start your research.
Bonus trades have less stringent risk parameters, and these trades have slightly more risk than trades I recommend for the Income Trader portfolio. Risk is still relatively low in a bonus trade, but it is not low enough to pass my most rigorous screens. We recommend closing all bonus trades when they trade at $ 0.10 or below.

I always recommend the use of limit orders when entering an options trade. A limit at the midpoint between the bid and ask prices will often be filled fairly quickly.
The charts below show this week’s top candidates: In the upper section of each chart, you can see the stock’s weekly price movement; in the bottom section, you’ll see the stock’s ITV (red line) and the ITV’s 20-week moving average (blue line). These charts usually show several previous signals and could help subscribers evaluate how successful signals were in the past.

Good Trading,
Amber Hestla
September 11, 2024 - 10:08 am
Demographic Trends Drive Long-Term Stock Market Growth
Last week, I discussed why I expect to see more money invested in the stock market, despite many analysts believing households are overexposed to stocks. Population changes are an important factor to consider.
To borrow a phrase widely used by political analysts, “demographics is destiny.” This idea highlights the significance of demographic trends in shaping political, economic, and social outcomes.
I believe the same is true in the stock market, especially when the largest demographic groups need to save more for retirement. This week, I want to share evidence that this process is already underway.
Below is a chart from the Federal Reserve. The blue line shows the value of pensions for households, while the red line shows the value of stocks for households.

Source: Federal Reserve, https://fred.stlouisfed.org/graph/fredgraph.png?g=1tBvc
Stocks became more valuable than pensions in 2018, but the importance of stocks has been growing since bottoming out in 1982. That marked the beginning of the bull market that ended with the internet bubble in 2000.
We can see the rise and fall of the stock market in the red line, with peaks in 2000 and 2007 followed by extended bear markets. We also observe the decline of traditional pensions over time. Even though the value of pensions held steady, they were in decline, with fewer and fewer workers covered by pensions each year. As a result, workers were forced to take on more responsibility for their retirement and turned to the stock market.
That’s a trend that won’t end. Defined benefit pensions aren’t coming back—corporations simply can’t afford them. Individuals will be increasingly forced to invest in stocks.
This is a long-term bullish factor for stocks. But I also want to highlight that our income strategy is a valuable addition to retirement planning.
Selling puts generates income, and we’ve proven that for years.
This strategy also grows wealth steadily. While there may be occasional losses, history shows we recover quickly. It also shows that, over time, this strategy steadily grows wealth. That’s important because it smooths out the bad years in the market, both in bull and bear markets when growth is below average.
Steady growth reduces risk—at least by my definition of risk. Frankly, with so many people forced to rely on their own investments for retirement, I believe more people should define risk as I do.
To me, risk means that my money isn’t there when I need it. That’s unacceptable. A diversified portfolio with a steady, high-income strategy minimizes that risk for me.
Today’s Trade: Generate 2.1% In MPC
Currently, MPC is trading around $ 163.54. This week, I recommend selling (to open) MPC Oct-18 $ 140 Puts for $ 0.60 – $ 0.85. That’s a put option on MPC with a strike price of $ 140 that expires on October 18, 2024 (MPC241018P00140000).

When entering the trade, I recommend using a limit order near or below the current ask price of the option. (A price quote will include a bid and ask price; trades are often completed between these two prices.)
For example, if the current quote on this option is “bid $ 0.60, ask $ 0.70,” I would suggest using a limit order to sell at $ 0.65. If that order is not filled within a few hours, you could lower the limit price based on the current quote. A limit order at this level will usually be filled quickly.
No matter what the current bid and ask prices are, I do not recommend trading outside the limit I set for the trade. For this trade, your limit price should be between $ 0.60 and $ 0.85.
As soon as your trade is executed, you will generate immediate income of about $ 60 (each contract controls 100 shares), assuming you enter the trade at the bottom of the range. (I’m using the bottom of the range because that’s the least amount of income we’ll accept for this trade, which gives us the most conservative estimate of our return.)
Selling this put will obligate you to buy MPC at $ 140 a share if the stock trades for less than that on October 18th (the last day these options can be traded).
Buying 100 shares of MPC at $ 140 each would cost $ 14,000. To initiate this trade, your broker will likely require you to deposit a percentage of that obligation in your account, like a down payment on a house.
This is called a “margin requirement.” It usually runs about 20% of the amount it would cost you to buy the shares. This MPC trade would require a margin deposit of $ 2,800 (20% of $ 14,000).
Here’s how the trade looks if the option expires worthless:

Assuming MPC trades for $ 140 or more on October 18th, we keep the premium and make a profit of $ 60 on $ 2,800, or 2.1%, in 37 days. If we can repeat a similar trade every 37 days, we will earn about 20.7% on our capital in 12 months.
Recommended Trade: Sell MPC Oct-18 $ 140 Puts for $ 0.60 – $ 0.85. Remember, each option contract you sell represents a potential obligation to purchase 100 shares of MPC. If you’re not comfortable owning more than 100 shares of MPC, don’t sell more than one put.
I don’t recommend using a stop-loss on this trade. I will be monitoring it closely and will send an immediate update if anything changes.
As always, I recommend readers use limit orders to execute trades. If prices move and you can’t get the premium you want, don’t chase the trade. Income Trader is a weekly publication, so you’ll get plenty of opportunities to Generate income selling puts and covered calls.

Royal Caribbean Cruises Ltd. (NYSE: RCL) is trading above the strike price and is on track to expire worthless later this month.
The Top Instant Income Opportunities This Week
Below you will find the top trade candidates identified by the Income Trader Volatility (ITV) indicator. Each of these trades recommends selling (to open) a put option. If you’re looking to make additional Instant Income trades, I can’t think of a better list of stocks to start your research.
Bonus trades have less stringent risk parameters, and these trades have slightly more risk than trades I recommend for the Income Trader portfolio. Risk is still relatively low in a bonus trade, but it is not low enough to pass my most rigorous screens. We recommend closing all bonus trades when they trade at $ 0.10 or below.

I always recommend the use of limit orders when entering an options trade. A limit at the midpoint between the bid and ask prices will often be filled fairly quickly.
The charts below show this week’s top candidates: In the upper section of each chart, you can see the stock’s weekly price movement; in the bottom section, you’ll see the stock’s ITV (red line) and the ITV’s 20-week moving average (blue line). These charts usually show several previous signals and could help subscribers evaluate how successful signals were in the past.

Good Trading,
Amber Hestla
September 4, 2024 - 9:00 am
Population Trends Point to Bullish Outlook in U.S. Stocks
I saw an interesting chart in The Wall Street Journal. U.S. households now have more of their net worth in stocks than ever before. According to JPMorgan estimates, stock holdings recently accounted for around 42% of their total financial assets, which is the highest on record in data going back to 1952.

This is widely viewed as bearish. The idea is that when too many investors are bullish, there isn’t enough cash on the sidelines to keep pushing prices up.
I think that’s wrong. That doesn’t mean prices will go straight up—they certainly won’t. Tuesday was a good reminder that stock prices can make sharp, rather large moves to the downside. But in the long run, it should pay to stay bullish.
Census Bureau data is a reason to be bullish. The charts below are population pyramids of the U.S.

These are population pyramids, bar graphs that show the distribution of different age groups in a population, divided by gender. Each bar represents a specific age group, such as 0-4 years, 5-9 years, and so on, all the way up to 100 and over.
The overall shape of the pyramid can tell us a lot about the population. A true “pyramid” shape, with a wide base and narrow top, indicates a growing population with many young people. If the pyramid looks more rectangular, it suggests that the population is stable, with similar numbers of people in each age group.
There are three pyramids in the chart, for 2000, 2010, and 2020. For the U.S., the 2000 pyramid has a more traditional “pyramid” shape, with a wider base and progressively narrower upper sections. This suggests a younger population, with a relatively high number of births and fewer older individuals.
The largest age groups are the younger ones (under 40 years old). The pyramid indicates a growing population, with a strong base of younger individuals who will move into the working-age group in the following years.
By 2010, the pyramid starts to shift toward a more rectangular shape, especially in the middle age groups. The middle age groups (30-64 years) have grown significantly, reflecting the aging of the large cohort born during the post-World War II baby boom (the “Baby Boomers”).
The base has narrowed somewhat, indicating a decline in birth rates. The elderly population (65 and older) has begun to increase, but not as sharply as in 2020.
The 2020 pyramid shows a more pronounced rectangular shape, with a clear bulge in the middle, indicating an aging population. The largest age groups are those in their late 30s to mid-60s, reflecting the continued aging of the Baby Boomer generation.
The base of the pyramid is noticeably narrower than in 2000, further evidence of declining birth rates. The top of the pyramid has broadened, indicating a significant increase in the elderly population as life expectancy has increased and the Baby Boomers have moved into retirement age.
The overall shape of the pyramid and its shifts over time have important implications for the country, but I’m not going to address those today. I want to highlight that the current population pyramid influences the first chart I showed, household allocation to stocks.
When the majority of the population is of working age, there should be a relatively high exposure to the stock market. These are individuals saving for retirement, depending on the long-term gains that stocks have historically delivered.
At the top, the large number of seniors also need long-term growth because people are living longer than ever. A longer lifespan, combined with historically low interest rates over the past few decades, has pushed seniors towards stocks.
You’re likely to see many articles worried about household exposure to the stock market. Remember why that is and think of it as bullish. It’s bullish because the population pyramid provides a good reason for the increased exposure. It’s also bullish because bull markets climb a wall of worry, and this is just another worry for the bulls to step on.
 Royal Caribbean Cruises Ltd. (NYSE: RCL) is trading above the strike price and is on track to expire worthless later this month.
The Top Instant Income Opportunities This Week
Below you will find the top trade candidates identified by the Income Trader Volatility (ITV) indicator. Each of these trades recommends selling (to open) a put option. If you’re looking to make additional Instant Income trades, I can’t think of a better list of stocks to start your research.
Bonus trades have less stringent risk parameters, and these trades have slightly more risk than trades I recommend for the Income Trader portfolio. Risk is still relatively low in a bonus trade, but it is not low enough to pass my most rigorous screens. We recommend closing all bonus trades when they trade at $ 0.10 or below.

I always recommend the use of limit orders when entering an options trade. A limit at the midpoint between the bid and ask prices will often be filled fairly quickly.
The charts below show this week’s top candidates: In the upper section of each chart, you can see the stock’s weekly price movement; in the bottom section, you’ll see the stock’s ITV (red line) and the ITV’s 20-week moving average (blue line). These charts usually show several previous signals and could help subscribers evaluate how successful signals were in the past.


August 28, 2024 - 3:28 pm
Powell’s Speech: Lower Rates Likely, Options Market in Focus
Last week, Fed Chairman Powell attended the Jackson Hole symposium, a widely anticipated event where the Chairman is expected to provide unique insights into monetary policy. Some years, this doesn’t materialize, and on average, stocks show little change following the news. But occasionally, there are fireworks.
In 2022, Powell sent the S&P 500 down about 7% after vowing in a brief speech to do whatever it takes to bring inflation back to the central bank’s 2% target, warning that higher rates could bring pain and increase unemployment.
This year was better for the markets.
Powell emphasized that inflation has significantly declined, and the labor market has eased quite a bit. He noted, “We have made a good deal of progress” towards restoring price stability and maintaining a strong labor market.
He acknowledged that the worst of the pandemic-related economic distortions are fading. Supply chains have returned to normal, and the labor market is no longer overheated. Inflation is now “much closer to our objective” of 2%, with prices having risen 2.5% over the past 12 months.
Of course, he provided a balanced view, warning that the risks to both sides of the Federal Reserve’s dual mandate—price stability and maximum employment—require careful attention as the economy continues to evolve.
Powell admitted to some mistakes. He said the Fed initially viewed the post-Covid inflation surge as transitory, expecting it to pass quickly. However, as inflation broadened from goods to services and became more persistent, the Fed recognized the need for a strong policy response, which began in November 2021.
Despite the surge in prices, he highlighted the fact that inflation expectations remained low, noting that “anchored inflation expectations, reinforced by vigorous central bank actions, can facilitate disinflation without the need for slack.” He praised the public’s confidence in the central bank’s ability to achieve 2% inflation over time, emphasizing that this confidence has been built over decades and reinforced by the Fed’s recent actions.
Throughout the speech, Powell underscored the uniqueness of the pandemic economy and the ongoing need for humility and adaptability in monetary policy. He emphasized that the Fed remains committed to learning from the past and applying those lessons to current challenges, stating, “The limits of our knowledge—so clearly evident during the pandemic—demand humility and a questioning spirit focused on learning lessons from the past.”
The takeaway from the speech has been widely reported: “The time has come for policy to adjust. The direction of travel is clear, and the timing and pace of rate cuts will depend on incoming data, the evolving outlook, and the balance of risks.”
Lower interest rates are on the horizon, and that will affect the options markets.
Lower rates reduce the risk-free rate, a key component in options pricing models like Black-Scholes. This leads to lower premiums on options, which affects both buyers and sellers, assuming everything else remains the same.
But everything doesn’t remain the same.
Lower rates typically lead to increased stock market volatility as investors search for higher yields, and this volatility can increase the premiums on options despite the lower risk-free rate. Additionally, as stocks potentially rise in response to lower rates, the likelihood of options expiring worthless increases, benefiting our out-of-the-money put options.
I expect a more favorable risk-reward profile for us as I maintain my strict risk standards and apply the strategy that has served us well for over a decade.
Today’s Trade: Generate 1.8% In RCL
Currently, RCL is trading around $ 169.02. This week, I recommend selling (to open) RCL Sep-20 $ 150 Puts for $ 0.55 – $ 0.75. That’s a put option on RCL with a strike price of $ 150 that expires on September 20, 2024 (RCL240920P00150000).

When entering the trade, I recommend using a limit order near or below the current ask price of the option. (A price quote will include a bid and ask price; trades are often completed between these two prices.)
For example, if the current quote on this option is “bid $ 0.60, ask $ 0.70,” I would suggest using a limit order to sell at $ 0.65. If that order is not filled within a few hours, you could lower the limit price based on the current quote. A limit order at this level will usually be filled quickly.
No matter what the current bid and ask prices are, I do not recommend trading outside the limit I set for the trade. For this trade, your limit price should be between $ 0.55 and $ 0.75.
As soon as your trade is executed, you will generate immediate income of about $ 55 (each contract controls 100 shares), assuming you enter the trade at the bottom of the range. (I’m using the bottom of the range because that’s the least amount of income we’ll accept for this trade, which gives us the most conservative estimate of our return.)
Selling this put will obligate you to buy RCL at $ 150 a share if the stock trades for less than that on September 20 (the last day these options can be traded).
Buying 100 shares of RCL at $ 150 each would cost $ 15,000. To initiate this trade, your broker will likely require you to deposit a percentage of that obligation in your account, like a down payment on a house.
This is called a “margin requirement.” It usually runs about 20% of the amount it would cost you to buy the shares. This RCL trade would require a margin deposit of $ 3,000 (20% of $ 15,000.)
Here’s how the trade looks if the option expires worthless:
|
Sell (to Open) RCL Sep-20 $ 150 Puts For $ 0.55 |
|
|
Contract (P.I.N.) Code: |
RCL240920P00150000 |
|
Margin Requirement: |
$ 3,000 |
|
Income From Premium (1 Contract): |
$ 55 |
|
Income From Premium (10 Contracts): |
$ 550 |
|
Return On Margin: |
1.8% |
|
Expiration Date: |
September 20, 2024 |
|
Days In Trade: |
24 |
Assuming RCL trades for $ 150 or more on September 20, we keep the premium and make a profit of $ 55 on $ 3,000, or 1.8%, in 24 days. If we can repeat a similar trade every 24 days, we will earn about 27.3% on our capital in 12 months.
Recommended Trade: Sell RCL Sep-20 $ 150 Puts for $ 0.55 – $ 0.75. Remember, each option contract you sell represents a potential obligation to purchase 100 shares of RCL. If you’re not comfortable owning more than 100 shares of RCL, don’t sell more than one put.
I don’t recommend using a stop-loss on this trade. I will be monitoring it closely and will send an immediate update if anything changes.
As always, I recommend readers use limit orders to execute trades. If prices move and you can’t get the premium you want, don’t chase the trade. Income Trader is a weekly publication, so you’ll get plenty of opportunities to Generate income selling puts and covered calls. For information on how to execute trades, read Profitable Trading’s Brokerage Guide.
________________________________________
Puts: Portfolio & Updates
|
TRADE |
DATE SOLD |
PRICE |
RECENT PRICE |
MARGIN DEPOSIT |
RETURN ON MARGIN |
|
Sell RCL Aug-16 $ 120 Puts RCL240816P00120000 |
07/17/24 |
$ 0.50 |
$ 0.04 |
$ 2,400 |
2.1% |
RCL Holdings, Inc. (Nasdaq: RCL) was closed early for a gain.
The Top Instant Income Opportunities This Week
Below you will find the top trade candidates identified by the Income Trader Volatility (ITV) indicator. Each of these trades recommends selling (to open) a put option. If you’re looking to make additional Instant Income trades, I can’t think of a better list of stocks to start your research.
Bonus trades have less stringent risk parameters, and these trades have slightly more risk than trades I recommend for the Income Trader portfolio. Risk is still relatively low in a bonus trade, but it is not low enough to pass my most rigorous screens. We recommend closing all bonus trades when they trade at $ 0.10 or below.
|
THIS WEEK’S TOP CANDIDATES (SELL TO OPEN) |
||||||||
|
Option & |
Bid/Ask |
20% |
Return On |
Ann. |
Earnings |
|||
|
Sell STX $ 90 Puts STX240920P00090000 |
$ 0.40 |
$ 1,800 |
2.2% |
33.4% |
Oct. 24-28 |
|||
|
Sell TRU $ 90 Puts TRU240920P00090000 |
$ 0.60 |
$ 1,800 |
3.3% |
50.1% |
Oct. 22-28 |
|
|
|
I always recommend the use of limit orders when entering an options trade. A limit at the midpoint between the bid and ask prices will often be filled fairly quickly.
The charts below show this week’s top candidates: In the upper section of each chart, you can see the stock’s weekly price movement; in the bottom section, you’ll see the stock’s ITV (red line) and the ITV’s 20-week moving average (blue line). These charts usually show several previous signals and could help subscribers evaluate how successful signals were in the past.


Good Trading,
Amber Hestla